
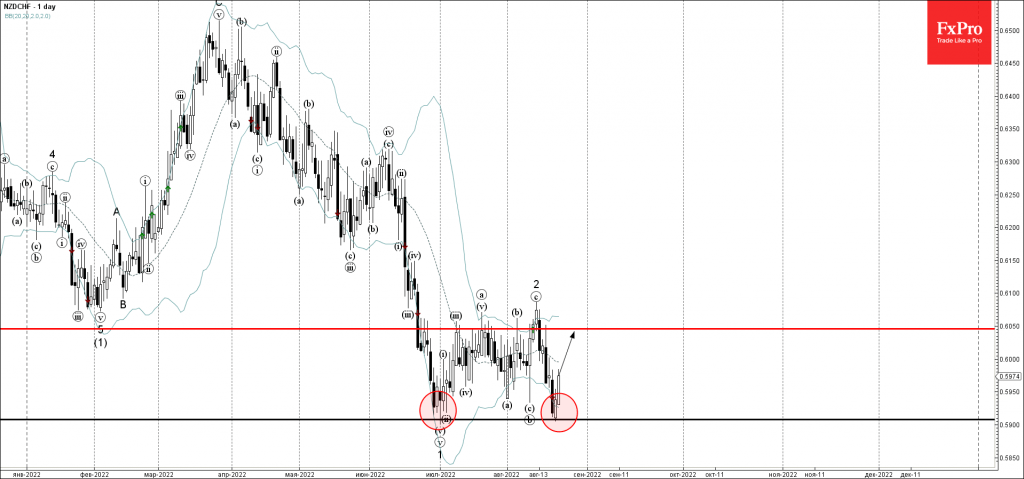
- NZDCHF reversed from support level 0.5900
- Likely to rise to resistance level 0.6050
NZDCHF currency pair recently reversed up from the key support level 0.5900 (which stopped the sharp downtrend at the end of June) standing below the lower daily Bollinger Band.
The upward reversal from the support level 0.5900 created the daily Piercing Line chart pattern.
NZDCHF currency pair can be expected to rise further to the next resistance level 0.6050 (which reversed the pair multiple times from the start of July).


