
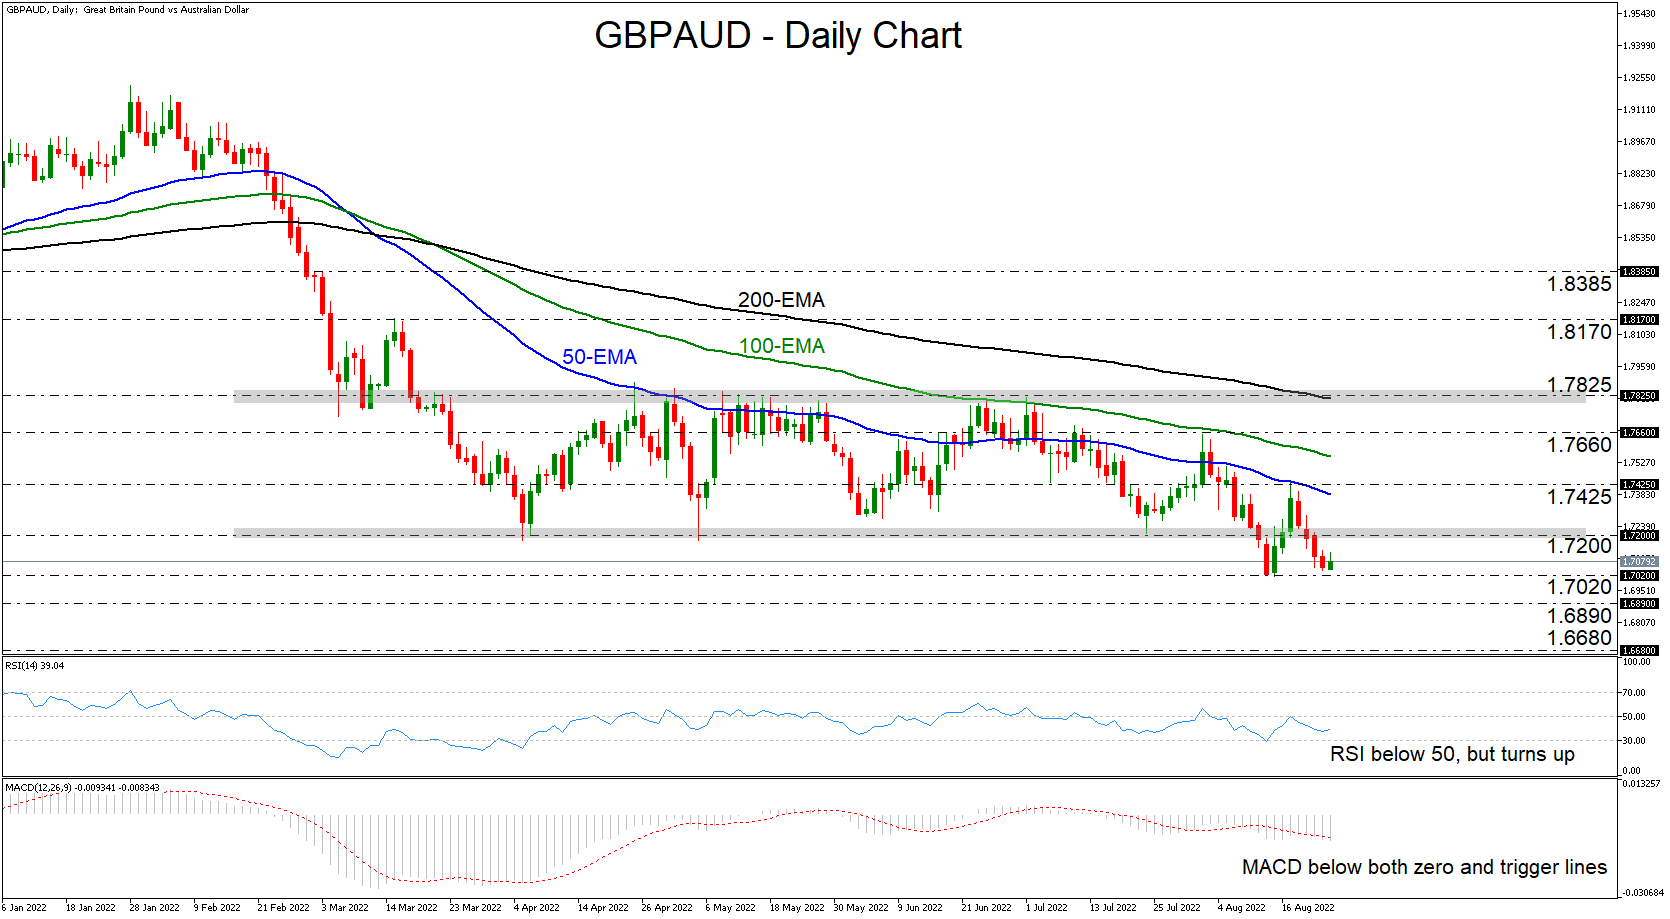
GBPAUD came under selling interest after it hit resistance at the crossroads of the 1.7425 level and the 50- exponential moving average (EMA) on August 17. The slide took the pair below the 1.7200 barrier, which acted as the lower bound of the sideways range it had been trading within between March 18 and August 11. This implies that the bears are not willing to give up any time soon.
Both the daily oscillators detect downside speed, adding to the notion of further declines. The RSI lies below 50, while the MACD runs below both its zero and trigger lines, pointing down. That said, the RSI has ticked up today, which raises the risk of a possible bounce before the next leg south.
A clear and decisive break below 1.7020, marked by the lows of August 12 and 15, would confirm a lower low and may encourage declines towards the 1.6890 level, marked by the low of November 2, 2017. If the bears are not willing to stop there either, a dive towards the 1.6680 area may be possible. That zone attracted the buyers back on October 20, 2017.
The outlook may start turning bullish upon a break above 1.7825, the upper boundary of the aforementioned range. A breach of that zone could see scope for advances towards the March 15 high of 1.8170, the break of which may pave the way towards the 1.8385 area, defined as a resistance by the inside swing low of December 9 and the high of March 3.
All in all, GBPAUD slid back below the lower bound of a medium-term sideways range, which paints a negative picture. However, the move that could increase the likelihood of more declines may be a dip below 1.7020.


