
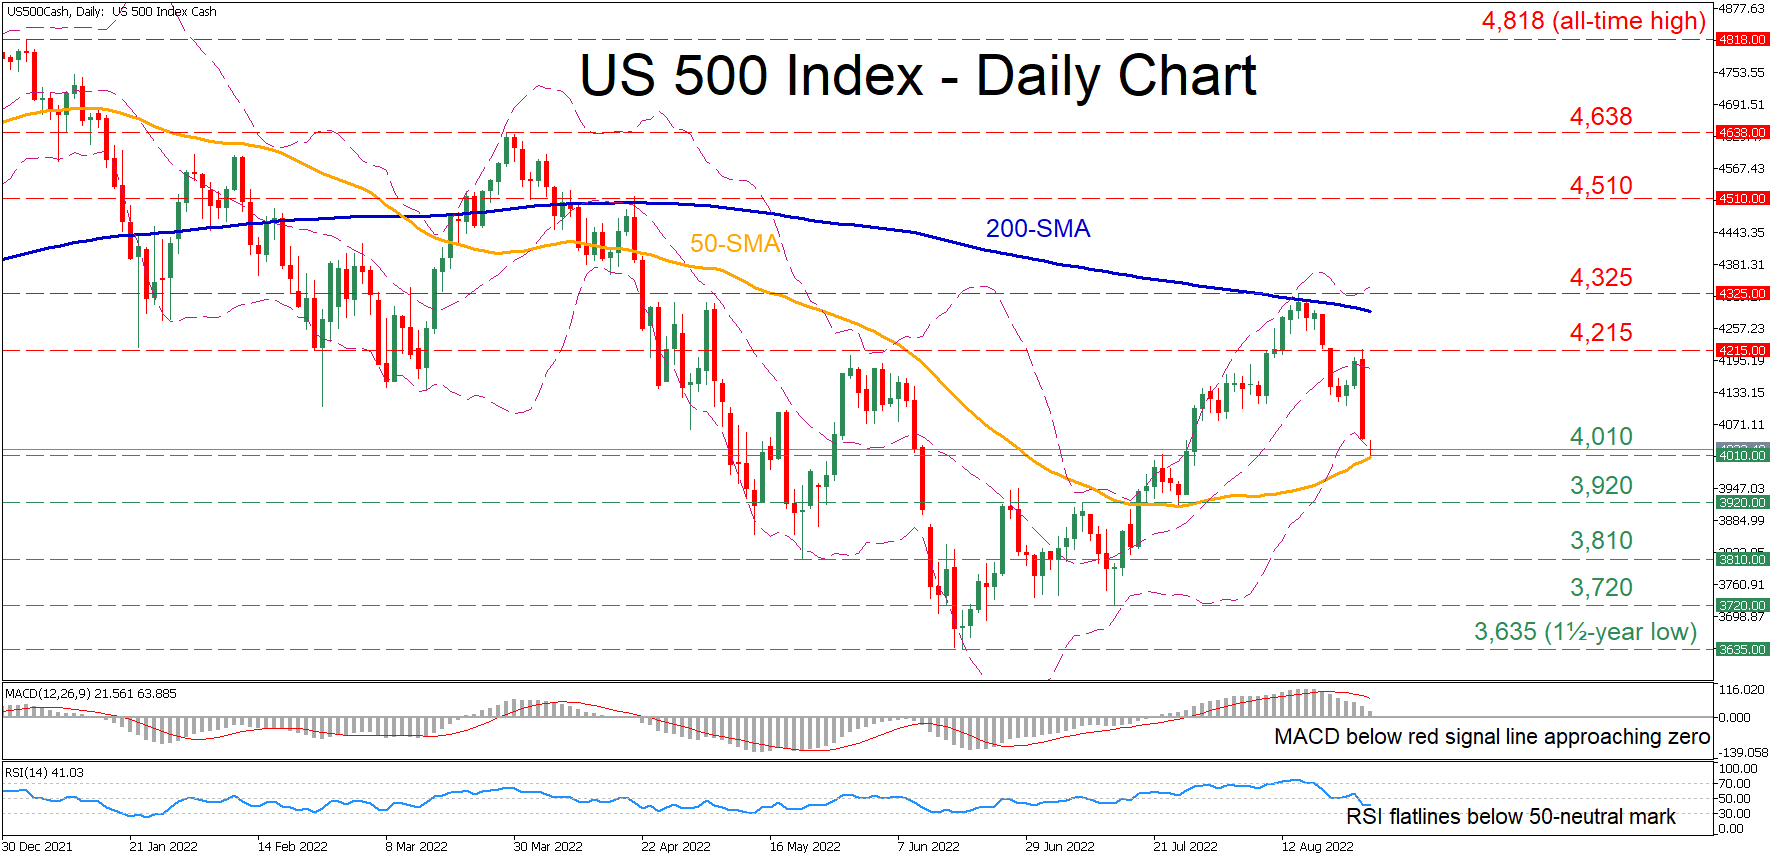
The US 500 stock index (cash) has experienced a massive drop in the previous session, extending the retreat from its recent resistance point. Even if the decline has come to a halt at the congested territory that includes the 50-day simple moving average (SMA) and the lower Bollinger band, the index retains its bearish near-term picture.
The short-term indicators currently suggest that bearish forces have gained the upper hand. Specifically, the MACD histogram is approaching zero after crossing below its red signal line, while the RSI has flatlined beneath its 50-neutral mark.
Should selling pressures intensify, initial support could be found at the 50-day SMA, currently at 4,010. Sliding beneath that floor, the index could descend towards 3,920 or lower to test the May low of 3,810. Any further declines may then cease at the July support of 3,720.
On the flipside, if negative momentum wanes and the price drifts higher, 4,215 might act as the first line of defence. Piercing through this region, the bulls could aim for the recent reversal point of 4,325 before 4,510 appears on the radar. A violation of the latter could open the door for the March peak of 4,638.
Overall, the US 500 index’s short-term picture has deteriorated, with a break below 50-day SMA potentially accelerating the downfall.


