
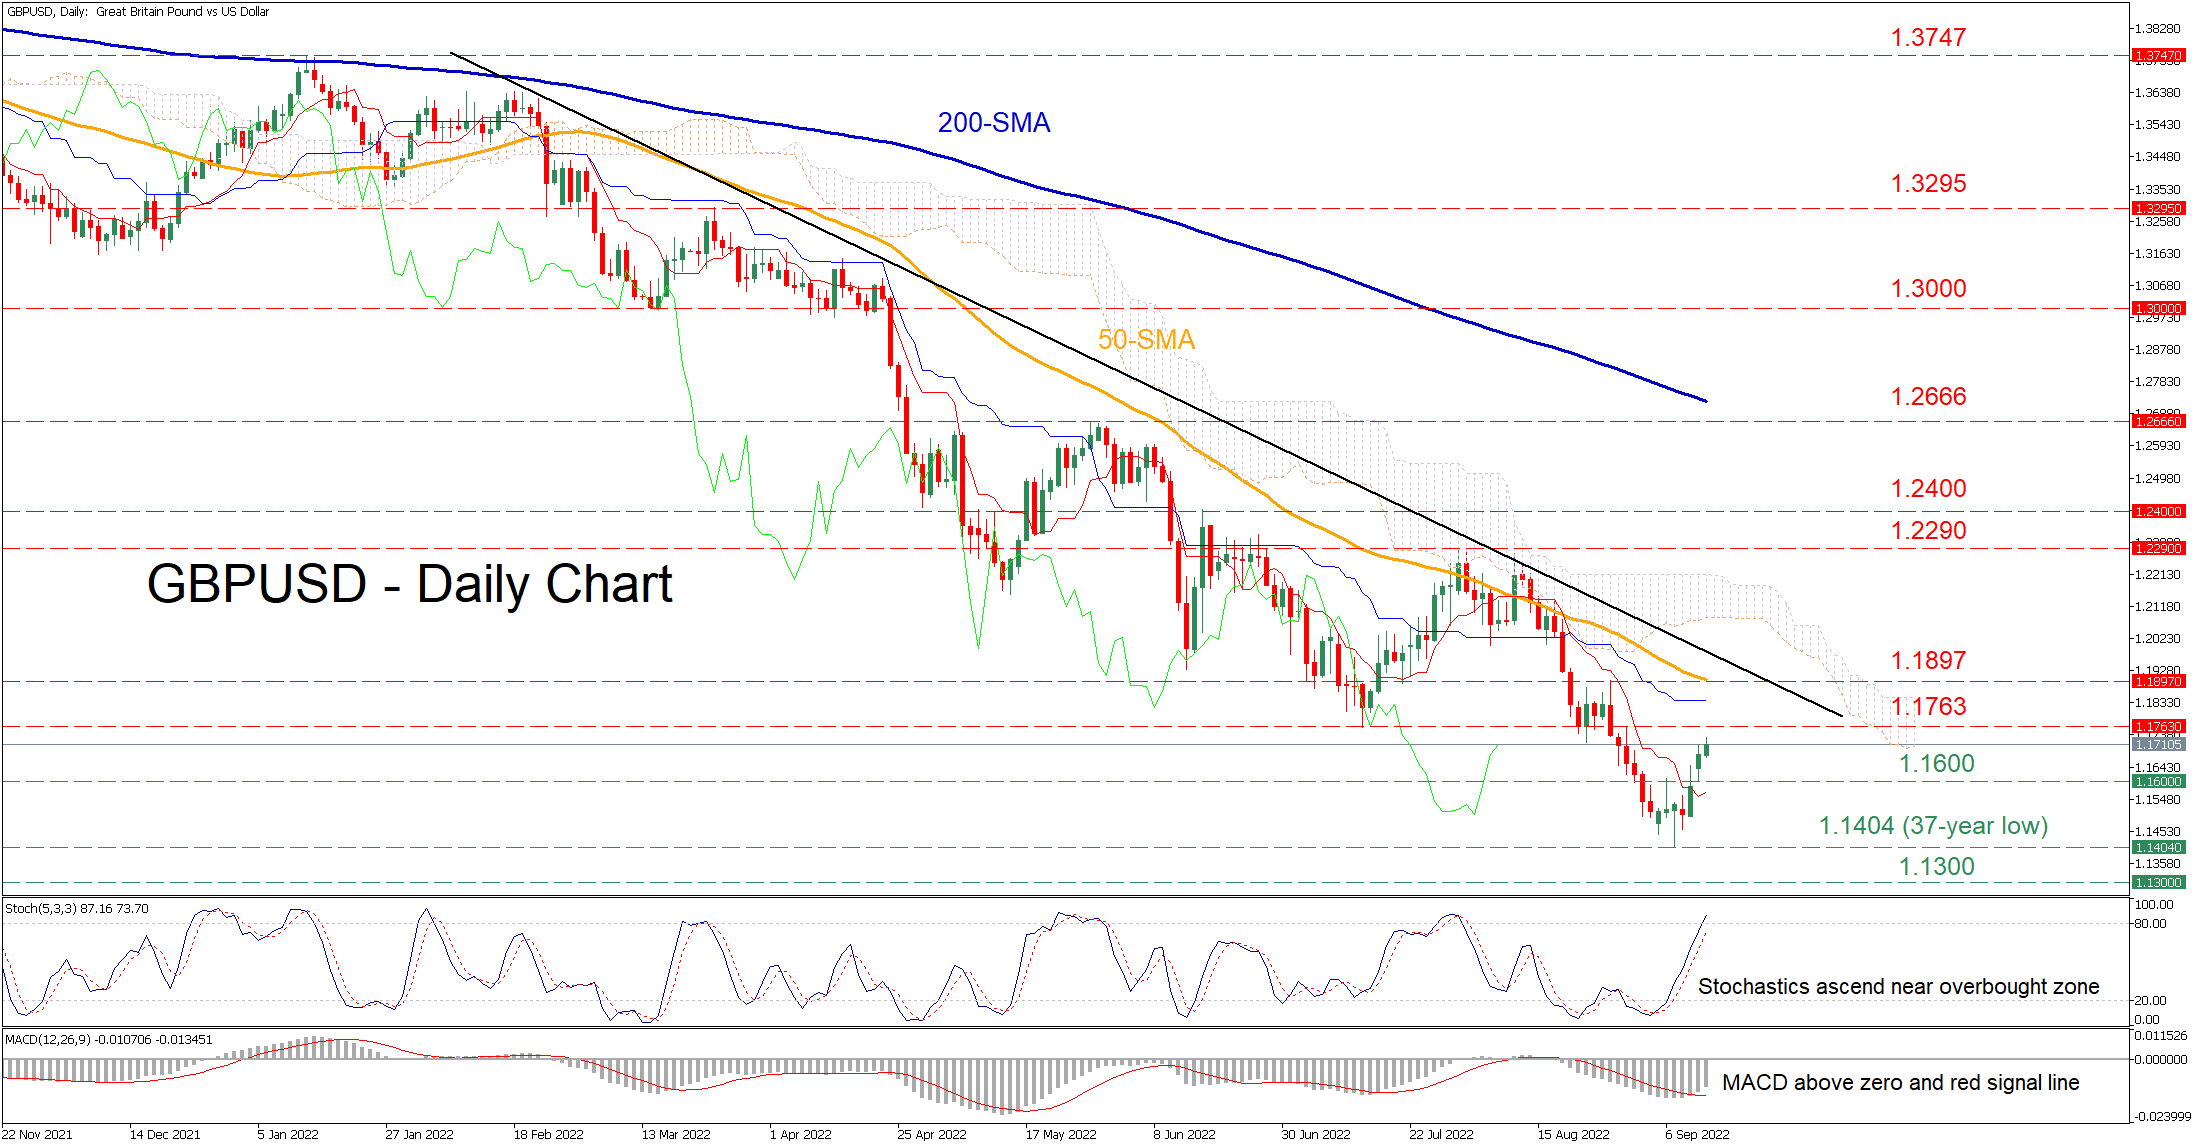
GBPUSD has been in a prolonged downtrend since the beginning of the year, generating a clear structure of lower highs and lower lows. Although the pair managed to find its feet at the 37-year low of 1.1404 and recoup some losses, it is a long path ahead until it reverses its bearish long-term structure.
The momentum indicators currently suggest a cautiously positive near-term tone. Specifically, the stochastic oscillator is ascending in the overbought area, while the MACD histogram has crossed above its red signal line but remains in the negative territory. Nevertheless, the price action remains way below the Ichimoku cloud, endorsing a broader bearish short-term picture.
Should buying interest persist, the price could challenge the recent support region of 1.1763. Conquering this barricade, the bulls might aim for the 1.1897 peak, which overlaps with the 50-day simple moving average (SMA). Crossing above the latter, the July high of 1.2290 could prove to be the next barrier for the pair to overcome.
To the downside, bearish actions may encounter initial support at the 1.1600 hurdle. Failing to halt there, the price could descend towards the 37-year low of 1.1404. A violation of the latter would send the pair to uncharted waters, where the 1.1300 psychological mark could act as the next support.
Overall, despite the latest rebound, GBPUSD is trading below its descending trendline and both the 50- and 200-day SMAs, indicating that the technical picture remains bearish on all time horizons. Nevertheless, a break above the 1.2290 zone could alter its short-term picture back to positive.


