
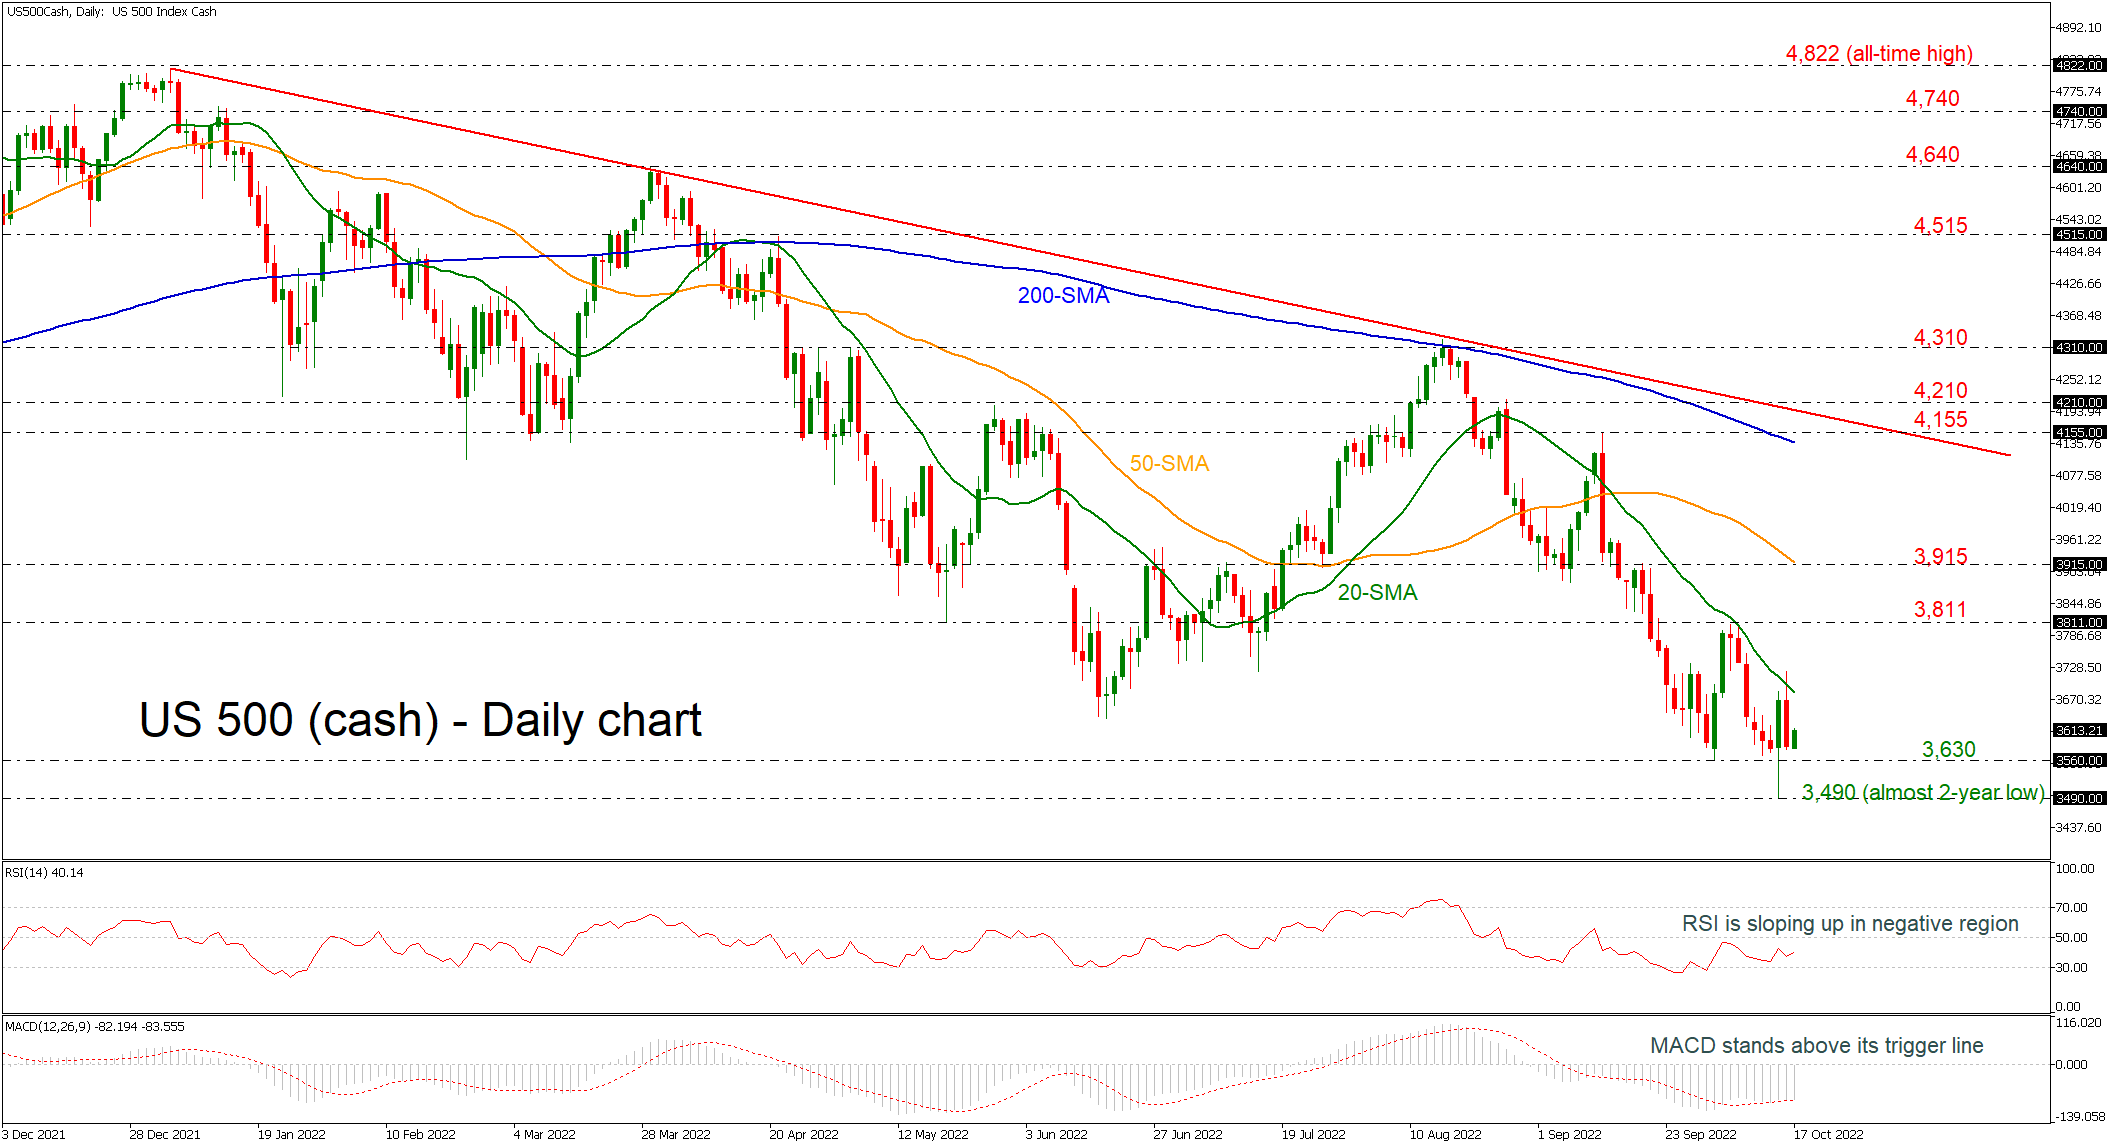
The US 500 cash index posted a negative spike towards a fresh almost two-year low of 3,490 on Thursday but failed to finish the week beneath the 200-weekly simple moving average (SMA) around 3,600.
According to the RSI, the market could maintain itself above the 3,630 support in the short-term as the RSI is positively sloped beneath its neutral threshold of 50. The MACD oscillator is hovering near its trigger line below the zero level.
On the upside, the price could attempt to overcome the 20-day SMA and retest the 3,811 level, which if successfully broken, could open the door for the 50-day SMA, which overlaps with the 3,915 resistance. Should traders continue to move the price up, bringing the short-term uptrend into play, resistance could then run towards the 200-day SMA at 4.135.
A reversal to the downside, however, could find immediate support at the 3,630 barrier, while slightly lower the two-year low of 3,490 could also come into view. If the latter fails to halt bearish movements, the next target could be the 3,225 support, registered back in September 2020.
Turning to the long-term, the outlook is bearish over the past nine months and only a decisive close above 200-day SMA and the descending trend line could change the view to positive.


