
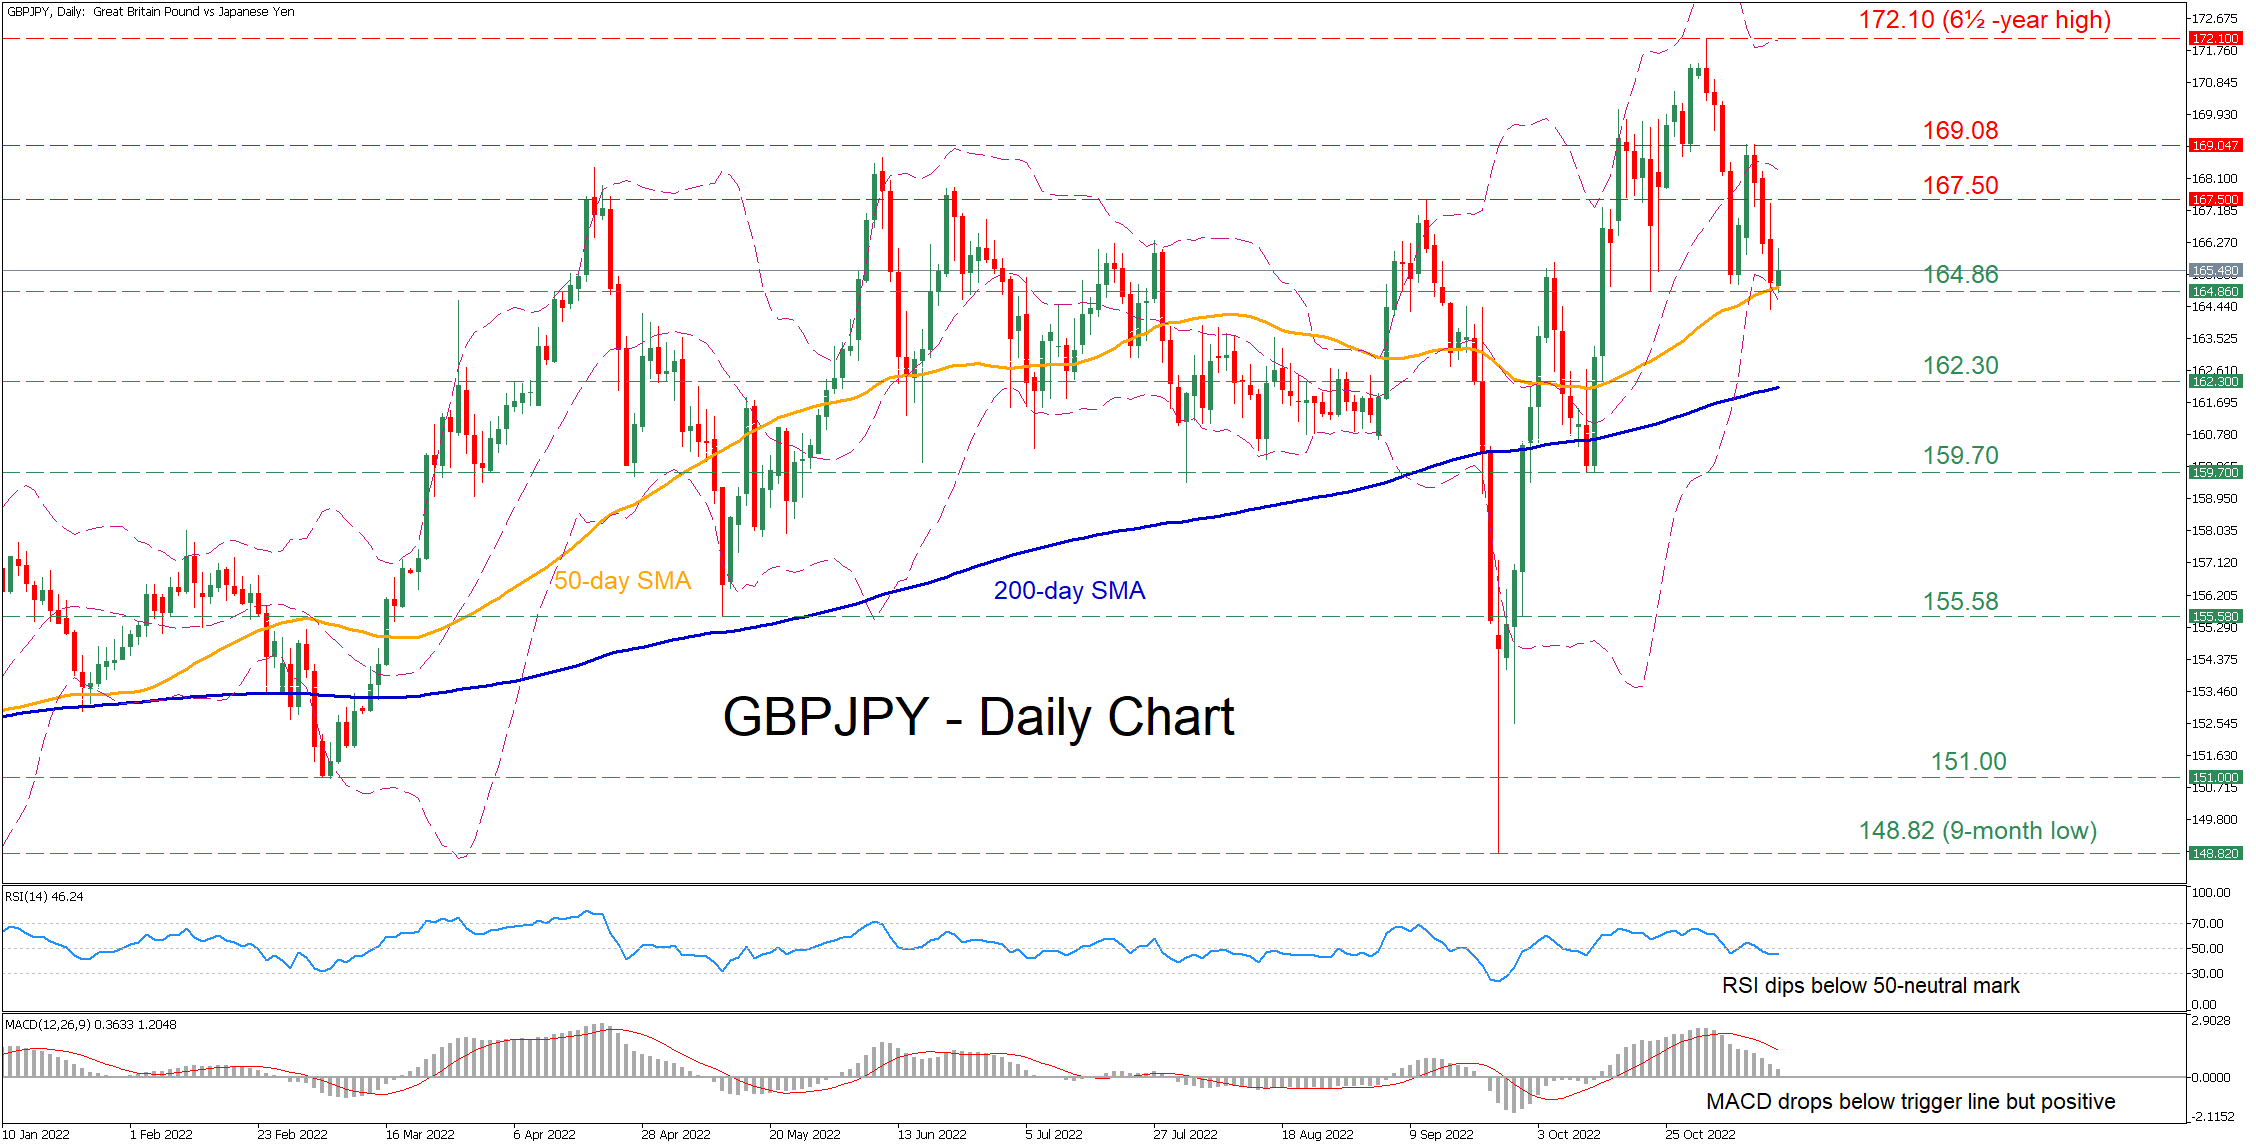
GBPJPY has experienced a steep uptrend since late September, with the price gaining almost 15% and posting a fresh 6½-year high of 172.10. Even though the pair has been losing ground in the short term, the 50-day simple moving average (SMA) has capped its downside.
The short-term oscillators are indicating that bearish forces are strengthening. Specifically, the RSI has dived beneath its 50-neutral mark, while the MACD histogram is softening below its red signal line but remains in the positive territory.
If selling pressures persist, immediate support could be met at 164.86, which overlaps with the 50-day SMA. Sliding beneath that floor, the bears could aim for 162.30 before the October low of 159.70 appears on the radar. Failing to halt there, the attention could shift to the May bottom of 155.58.
On the flipside, bullish actions could propel the price towards the October resistance of 167.50. Piercing through this region, further advances could come to a halt at the double-top region of 169.08. A break above the latter may then set the stage for the 6½-year high of 172.10.
Overall, GBPJPY managed to cease its decline for now, but its short-term picture is constantly deteriorating. Therefore, a break below the 50-day simple moving average could trigger a sustained downtrend.


