
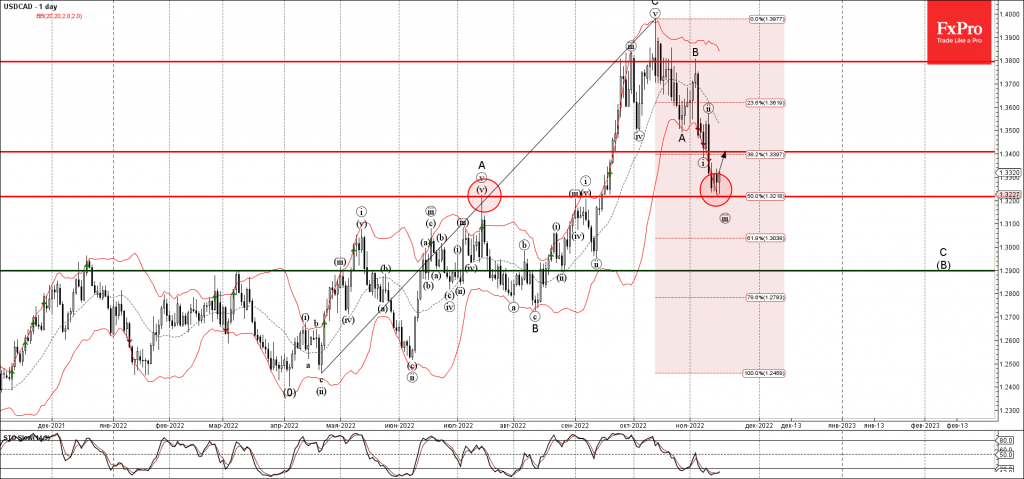
- USDCAD reversed from support level 1.3215
- Likely to fall to resistance level 1.3400
USDCAD recently reversed up from the key support level 1.3215 (previous monthly high from the start of July), lower daily Bollinger Band, intersecting with the 38.2% Fibonacci correction of the downward impulse from October.
The upward reversal from the support level 1.3215 stopped the earlier short-term impulse wave (iii) of the higher impulse waves C and (B).
Given the clear daily uptrend and the oversold daily Stochastic, USDCAD can be expected to rise further toward the next resistance level 1.3400 (former low of wave (i) from the start of November).


