
USDCHF suffered a painful drop of 5% last week, but the 2020 support trendline came to the rescue, halting the freefall at a seven-month low of 0.9355.
Although in bearish territory, the RSI and the stochastics are pushing higher to exit the oversold region, reflecting fading selling forces.
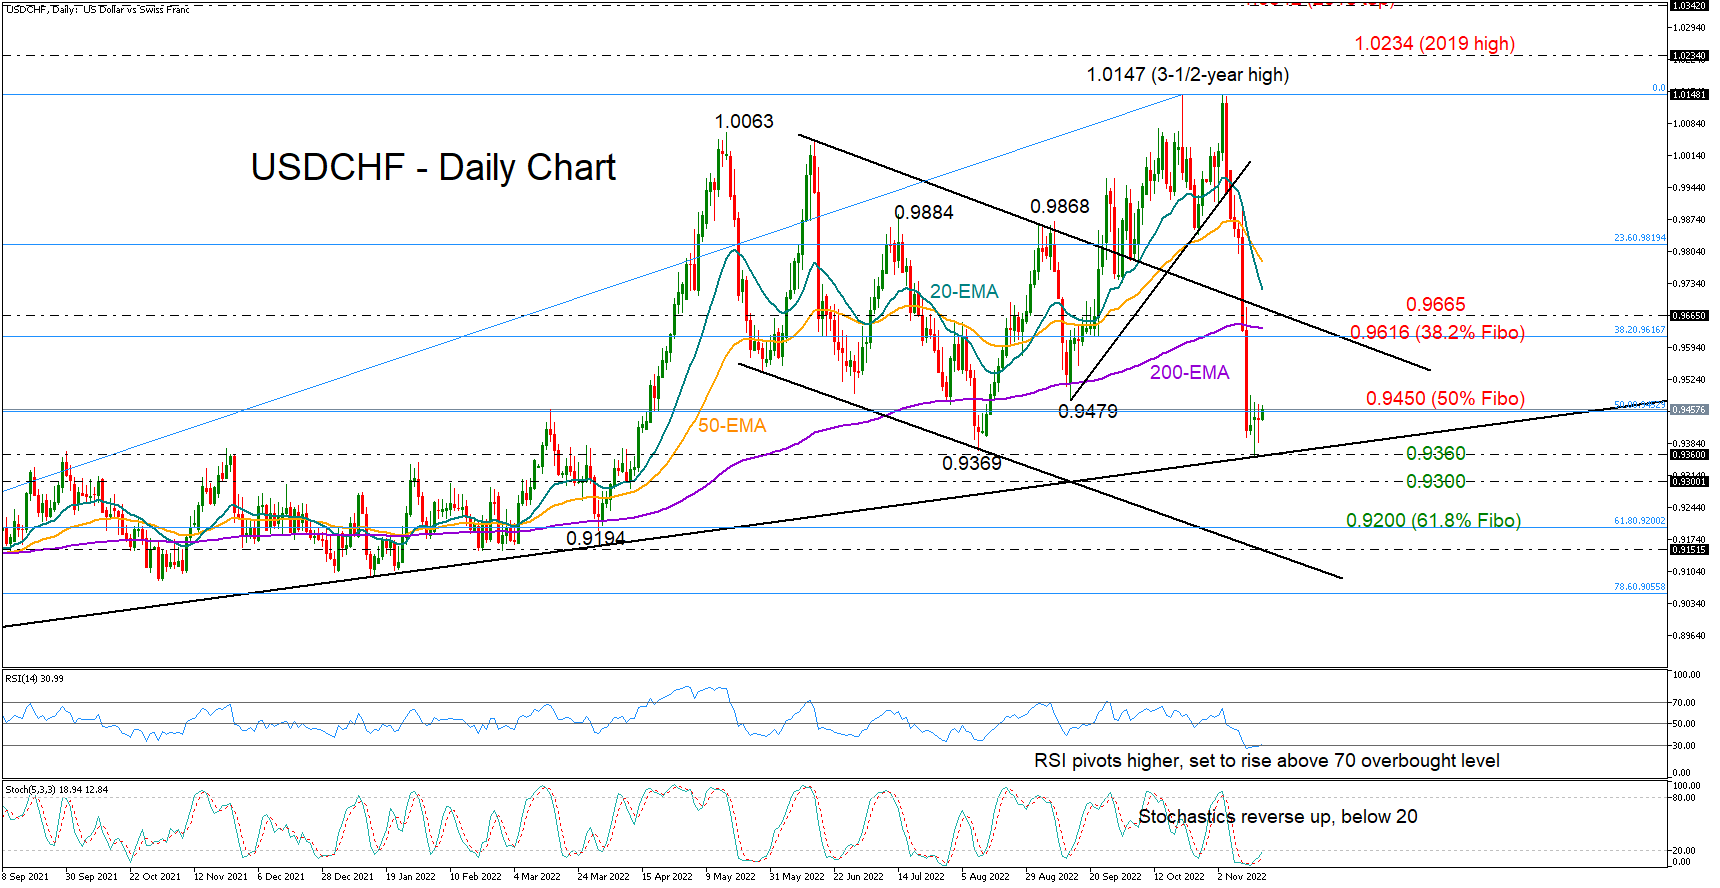
The pair has been trapped below the familiar resistance of 0.9450 so far this week and a penetration of that wall is probably required to trigger the next bullish phase. Note that the 50% Fibonacci retracement of the 0.8814-1.0147 downleg is in the same location. Hence, a decisive close above it could see a direct flight towards the 38.2% Fibonacci level of 0.9616, where the 200-day exponential moving average (EMA) is converging. Slightly higher, the resistance trendline of the broken descending channel could be another key area to watch near 0.9665.
Should the bears retake control, all eyes will turn again to the long-term ascending trendline at 0.9360. Failure to pivot here this time could initially press the price towards the 0.9300 psychological mark and then squeeze it towards the 61.8% Fibonacci of 0.9200. The channel’s lower boundary could next come on the radar near 0.9130.
In brief, the odds for an upside reversal are increasing in USDCHF, with traders likely waiting for a decisive close above the 0.9450 bar to target higher levels.


