
USDCAD had a lukewarm start to December, barely gaining bullish traction despite taking support from the 20-day simple moving average (SMA) at 1.3394.
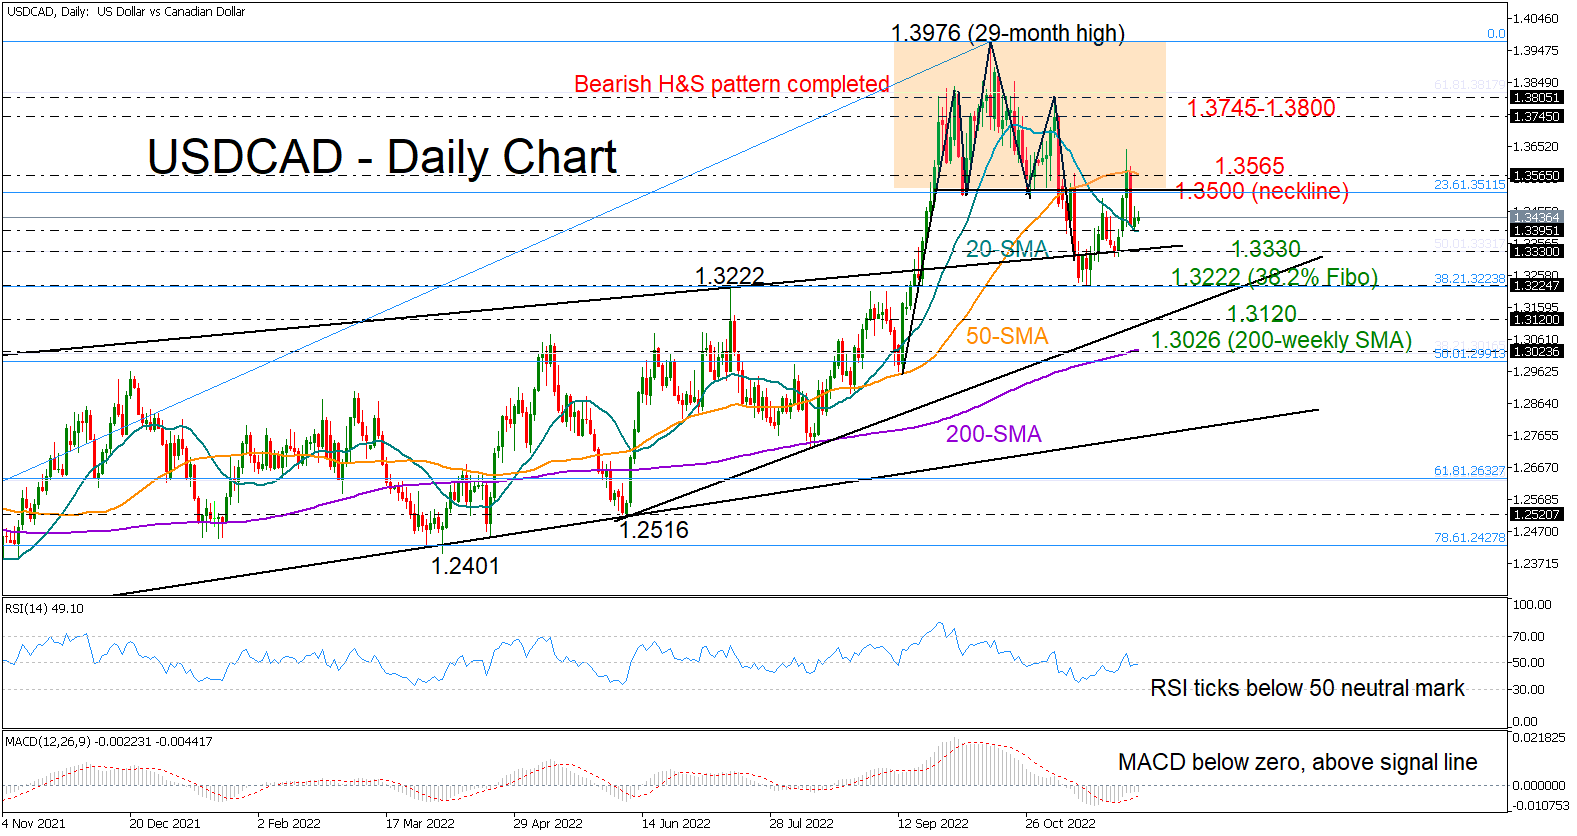
The pair has completed two consecutive negative months, charting a bearish head and shoulders pattern around the 29-month peak of 1.3976. Even though the bulls attempted to deactivate the bearish structure above the 1.3500 neckline this week, the 50-day simple moving average (SMA) pressed the price aggressively lower, keeping negative trend risks alive.
In momentum indicators, the RSI and the MACD have been trending up since mid-November, but the former has yet to climb successfully above its 50 neutral mark, while the latter hasn’t exited the negative zone.
Nevertheless, there are a couple of support levels that may prevent an outlook deterioration. The upper constraining line from August 2021 might immediately attract attention around 1.3330 if the 20-day SMA at 1.3400 gives way. Then, the 38.2% Fibonacci retracement of the 1.2006-1.3976 at 1.3222 could defend the neutral trajectory in the short-term picture. Should selling forces persist, the tentative ascending trendline could next come to the rescue near 1.3120. Otherwise, the decline may stretch towards the 200-day SMA and the 50% Fibonacci of 1.2990.
On the upside, the 1.3500–1.3565 zone and the 50-day SMA will be closely watched. A sustainable move above the bar could bolster the bullish action up to the 1.3745–1.3800 resistance region. Running higher, the pair will push for new higher highs above the 1.3976 top.
In brief, USDCAD is lacking bullish signals, with traders waiting for a clear break above 1.3500-1.3565 or below 1.3330 to direct the market accordingly.


