
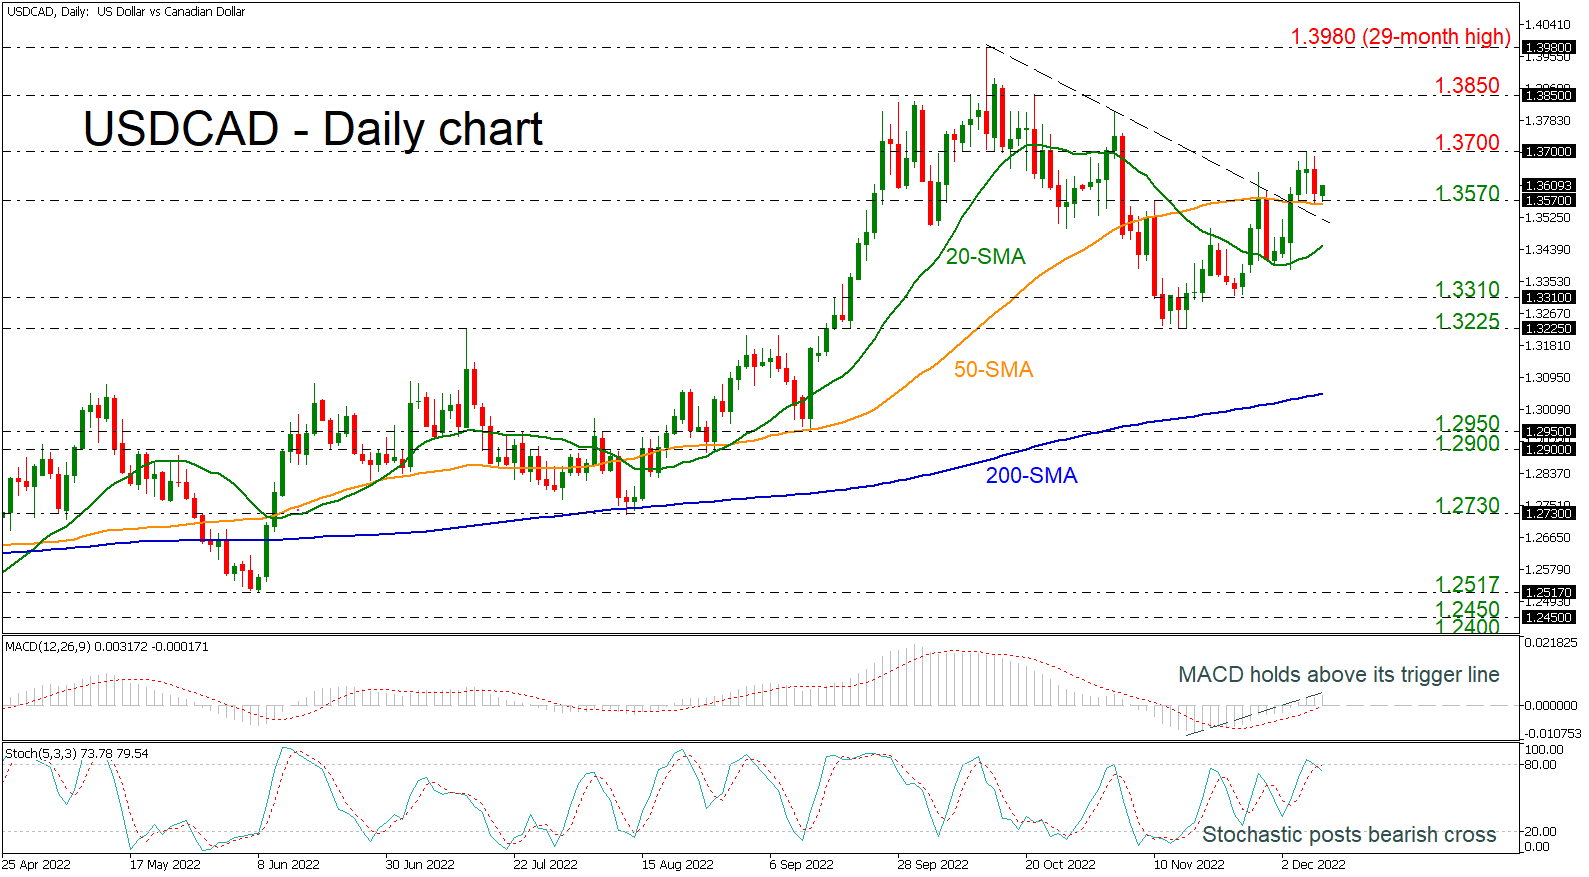
USDCAD is still trading above the short-term descending trend line and the strong 50-day simple moving average (SMA), which lies near the 1.3570 support. The MACD oscillator is holding above its trigger and zero lines; however, the stochastic posted a bearish cross within its %K and %D lines near the overbought territory, indicating that the next move may be to the downside.
Should the price close comfortably above the 1.3700 handle, which has been unbreakable over the past month, traders could add more value to the pair, pushing the market up to 1.3850. More advances could drive the bulls until the 29-month high of 1.3980, registered on October 13.
In the negative scenario where the 50-day SMA fails to halt downside movements at the moment, if the market moves lower, the 20-day SMA at 1.3450 could be the immediate support. If this proves easy to overcome this time, the decline may next pause somewhere between 1.3225-1.3310, investors could shift attention to the 200-day SMA at 1.3050.
In brief, USDCAD is showing some positive signs in the short-term, while in the bigger picture the outlook will brighten if there is a climb above 1.3980.


