
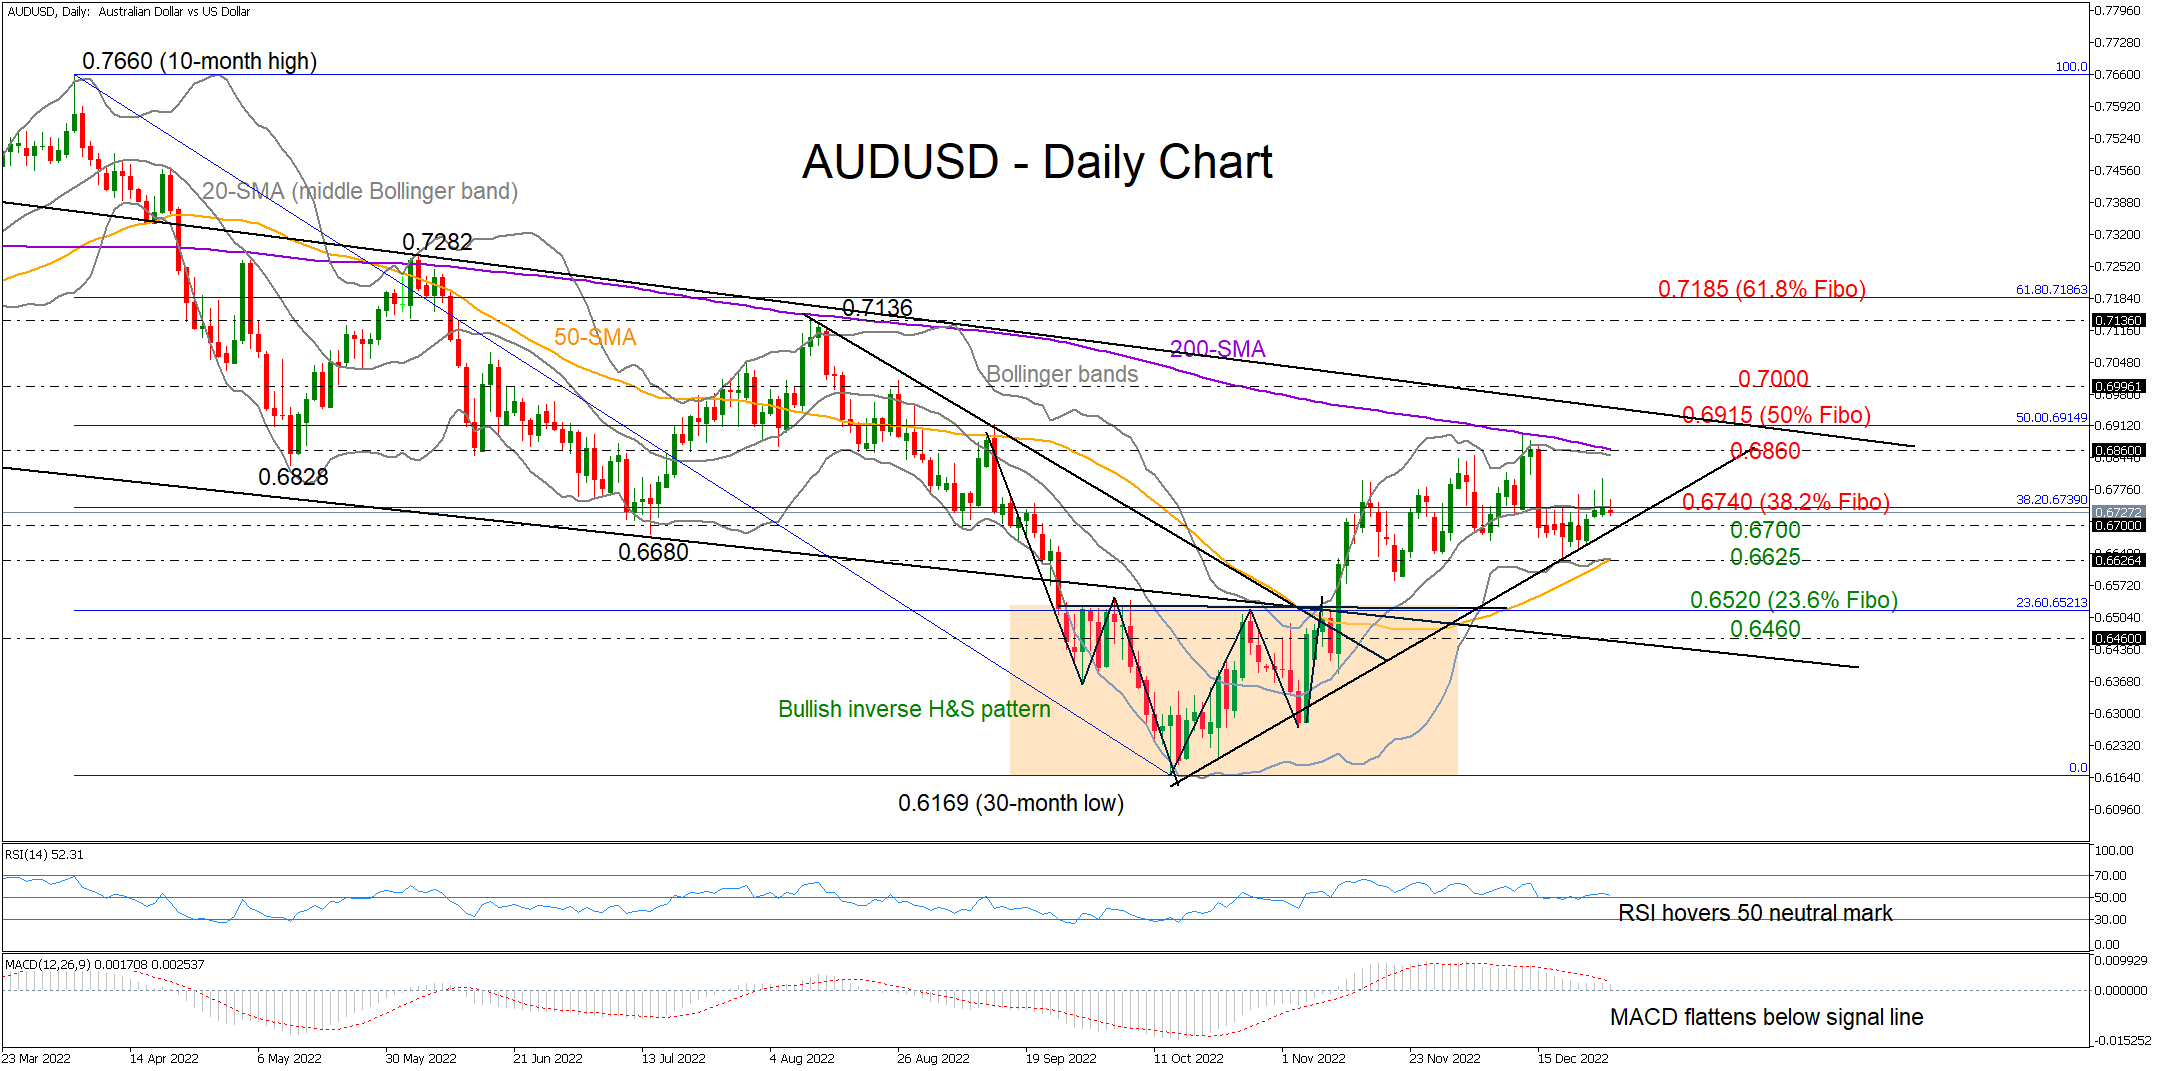
AUDUSD set another foothold around the two-month-old ascending trendline last week, correcting higher to test the 0.6800 level on Wednesday.
Despite the pickup, the 38.2% Fibonacci of the 0.7660–0.6169 downtrend and the 20-day simple moving average (SMA), which is also the middle Bollinger band, restrained the bulls around 0.6740 for the eighth consecutive trading day.
The momentum indicators are not giving directional signals, with the RSI hovering around its 50 neutral mark and the MACD flattening clearly below its red signal line. That said, as long as the price keeps trading within the lower Bollinger band area, downside movements are more likely than upside ones.
In case the support trendline cracks around 0.6700, the price could depreciate towards the 50-day SMA at 0.6625. Falling lower, selling pressures could intensify towards the neckline of the inverse head and shoulder pattern at 0.6520, where the 23.6% Fibonacci is placed too. Slightly lower, traders will also keep a close eye on the key constraining line coming from August 2021 at 0.6460.
In the positive scenario, where the pair breaks the wall at 0.6740, buyers will not get excited unless the recovery stretches above the 200-day SMA at 0.6860 and then beyond the tough descending trendline from May 2021 at 0.6915. Note that the 50% Fibonacci is in the neighborhood. Hence, a successful penetration higher could trigger a new bullish wave up to the 0.7136 – 0.7185 restrictive region, especially if the 0.7000 number gives way as well.
All in all, AUDUSD maintains a neutral status within the 0.6700 – 0.6740 zone. While a bullish breakout may attract fresh gains, a stronger rally above 0.7000 would be needed to upgrade the short-term outlook.


