
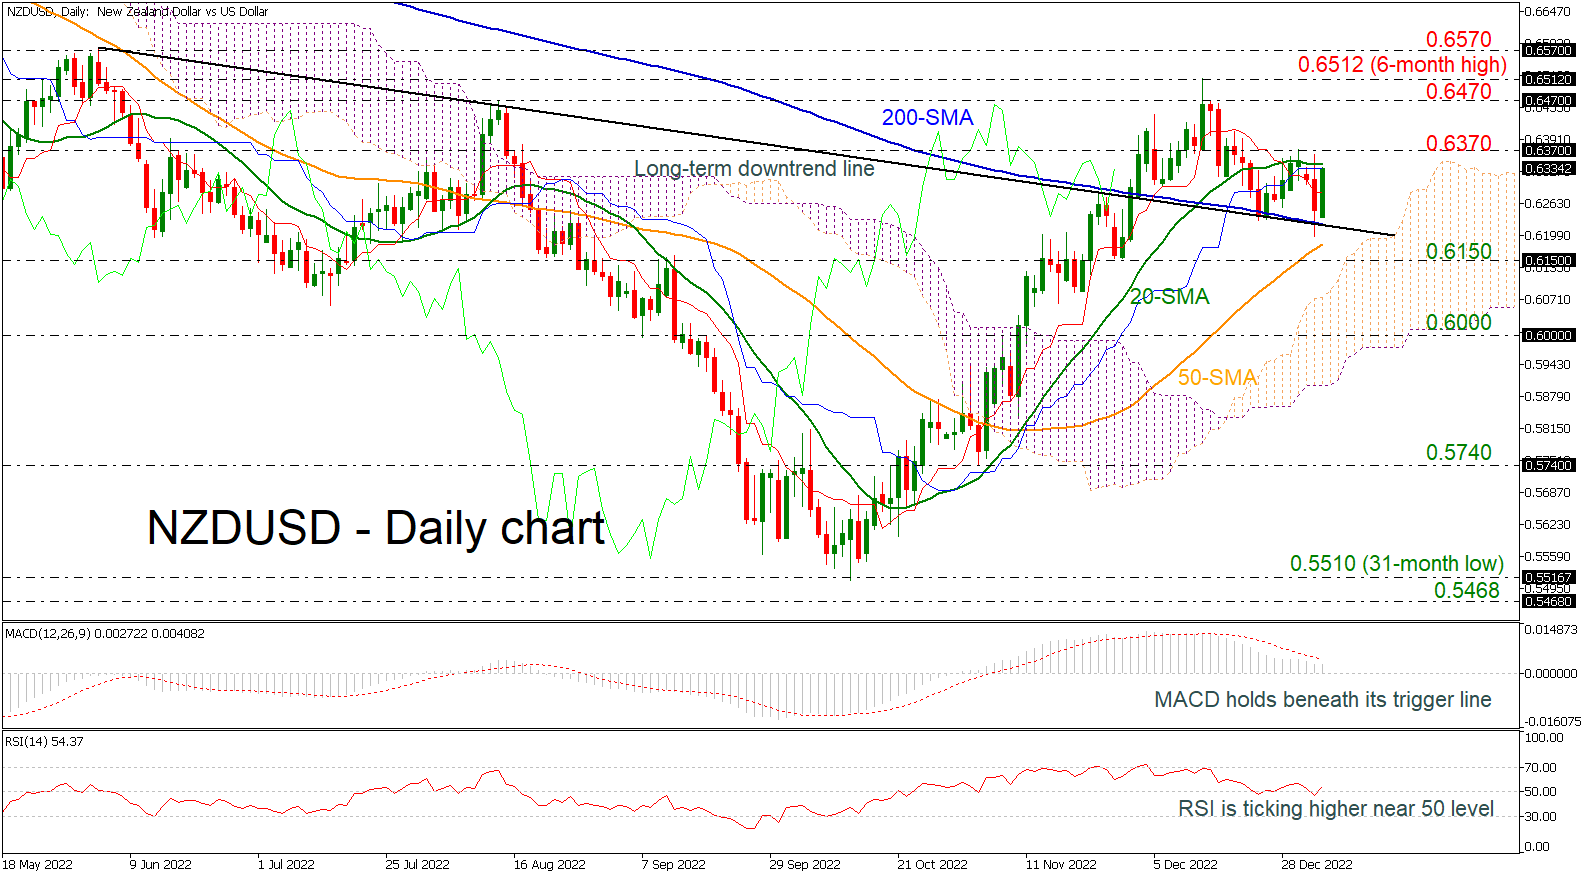
NZDUSD is rising after bouncing off the long-term descending trend line and the 200-day simple moving average (SMA) but is still hovering beneath the 20-day SMA.
The negatively aligned Tenkan-sen line serves as a testament to the negative short-term momentum. The Chikou Span, though, is signaling a potentially oversold market; a near-term reversal should thus not be ruled out. The MACD oscillator is still declining beneath its trigger line in the positive region; however, the RSI is pointing upwards above the neutral threshold of 50.
Immediate support to further declines may take place around the 200-day SMA at 0.6220 ahead of the 50-day SMA at 0.6180, while the 0.6150 barrier could provide additional support in case of steeper losses.
A move to the upside may meet resistance around the 20-day SMA at 0.6340 and the 0.6370 hurdle. More gains could open the way towards the 0.6470 barrier and the six-month peak of 0.6512, while any increases above the latter level would endorse the medium-term bullish outlook.
Overall, NZDUSD is still standing above the downtrend line, suggesting that upside pressures may come next.


