
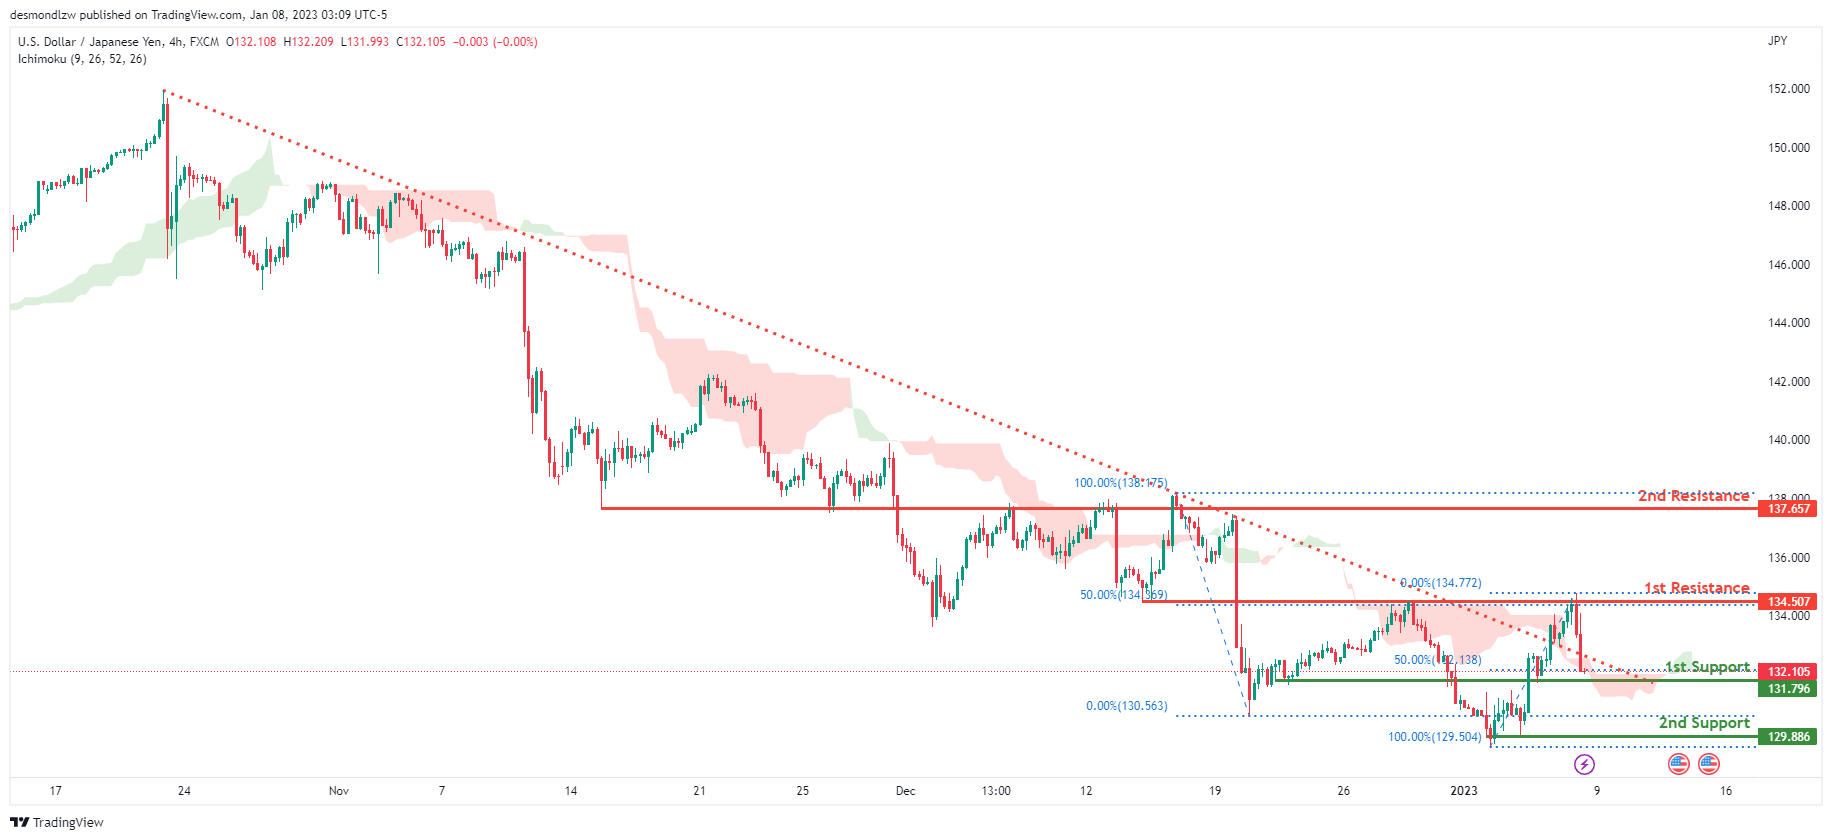
USD/JPY:
Looking at the H4 chart, my overall bias for USDJPY is bearish due to the current price being below the Ichimoku cloud, indicating a bearish market. To add support to this bias, price has also broken back into the descending trendline.If this bearish momentum continues, expect price to possibly break the 1st support at 131.796, where the 50% Fibonacci line is, before heading towards the 2nd support at 129.886, where the previous swing low is. In an alternate scenario, price could possibly head back up towards the 1st resistance level at 134.528, where the 50% Fibonacci line is.
Areas of consideration:
- H4 time frame, 1st resistance at 134.528
- H4 time frame, 2nd resistance at 137.657
- H4 time frame, 1st support at 131.796
- H4 time frame, 2nd support at 129.886
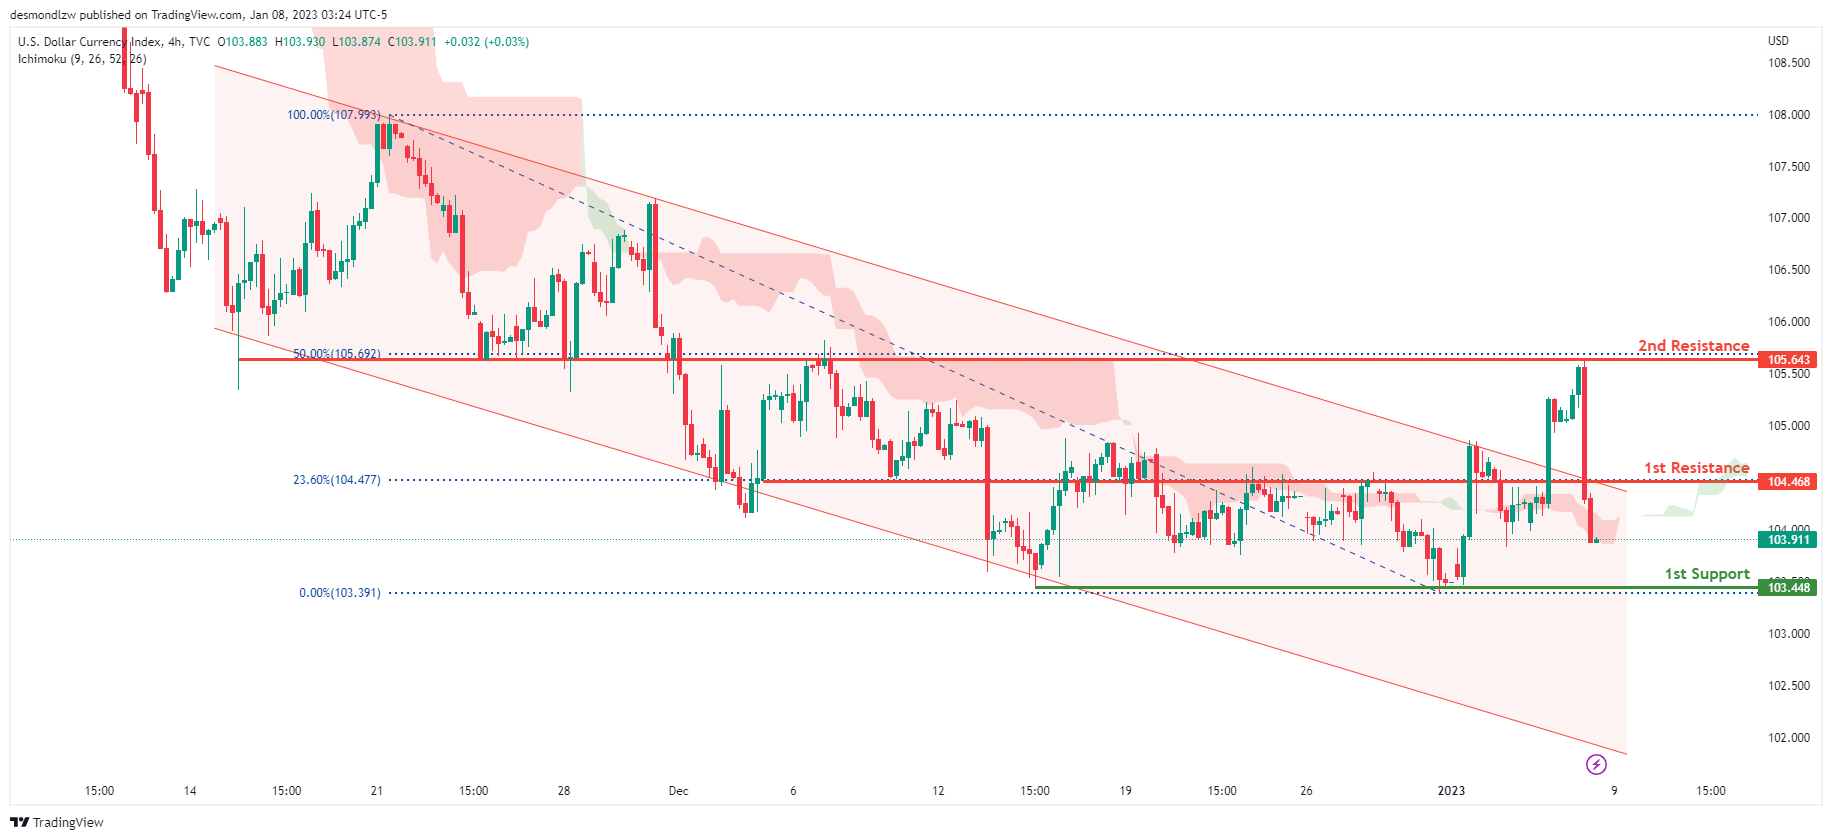
DXY:
Looking at the H4 chart, my overall bias for DXY is bearish due to the current price being below the Ichimoku cloud, indicating a bearish market. To add confluence to this, price is broken back down within the descending channel which indicates a bearish market. If this bearish momentum continues, expect the price to possibly continue heading towards the 1st support at 103.448, where the previous lows and liquidity hotspots are. In an alternative scenario, price could head back up to retest the 1st resistance at 104.468, where the 23.6% Fibonacci line is.
Areas of consideration:
- H4 time frame, 1st resistance at 104.468
- H4 time frame, 1st support at 103.448
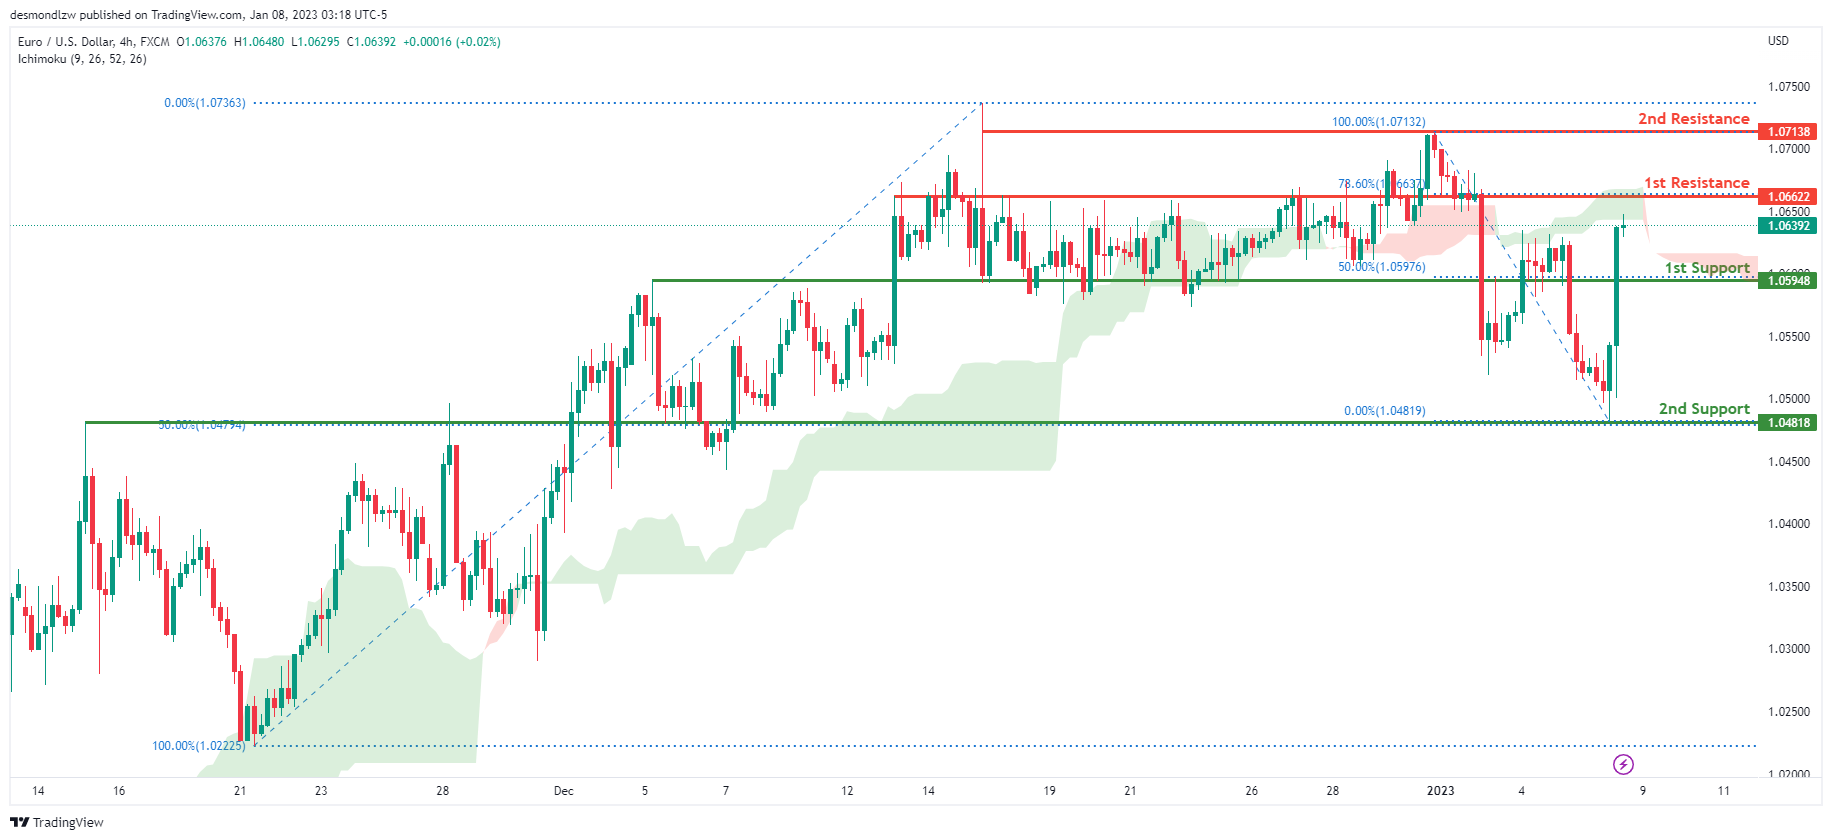
EUR/USD:
Looking at the H4 chart, my overall bias for EURUSD is bullish due to the current price attempting to cross above the Ichimoku cloud, indicating a possible shift to bullish market structure. If this bullish momentum continues, expect the price to possibly break the 1st resistance at 1.06622, where the 78.6% Fibonacci line is, before heading towards the 2nd resistance at 1.07138, where the previous high and liquidity hotspots are. In an alternate scenario, price could possibly head back down to retest the 1st support level at 1.05948, where the 50% Fibonacci line is.
Areas of consideration :
- H4 1st resistance at 1.06622
- H4 2nd resistance at 1.07138
- H4 1st support at 1.05948
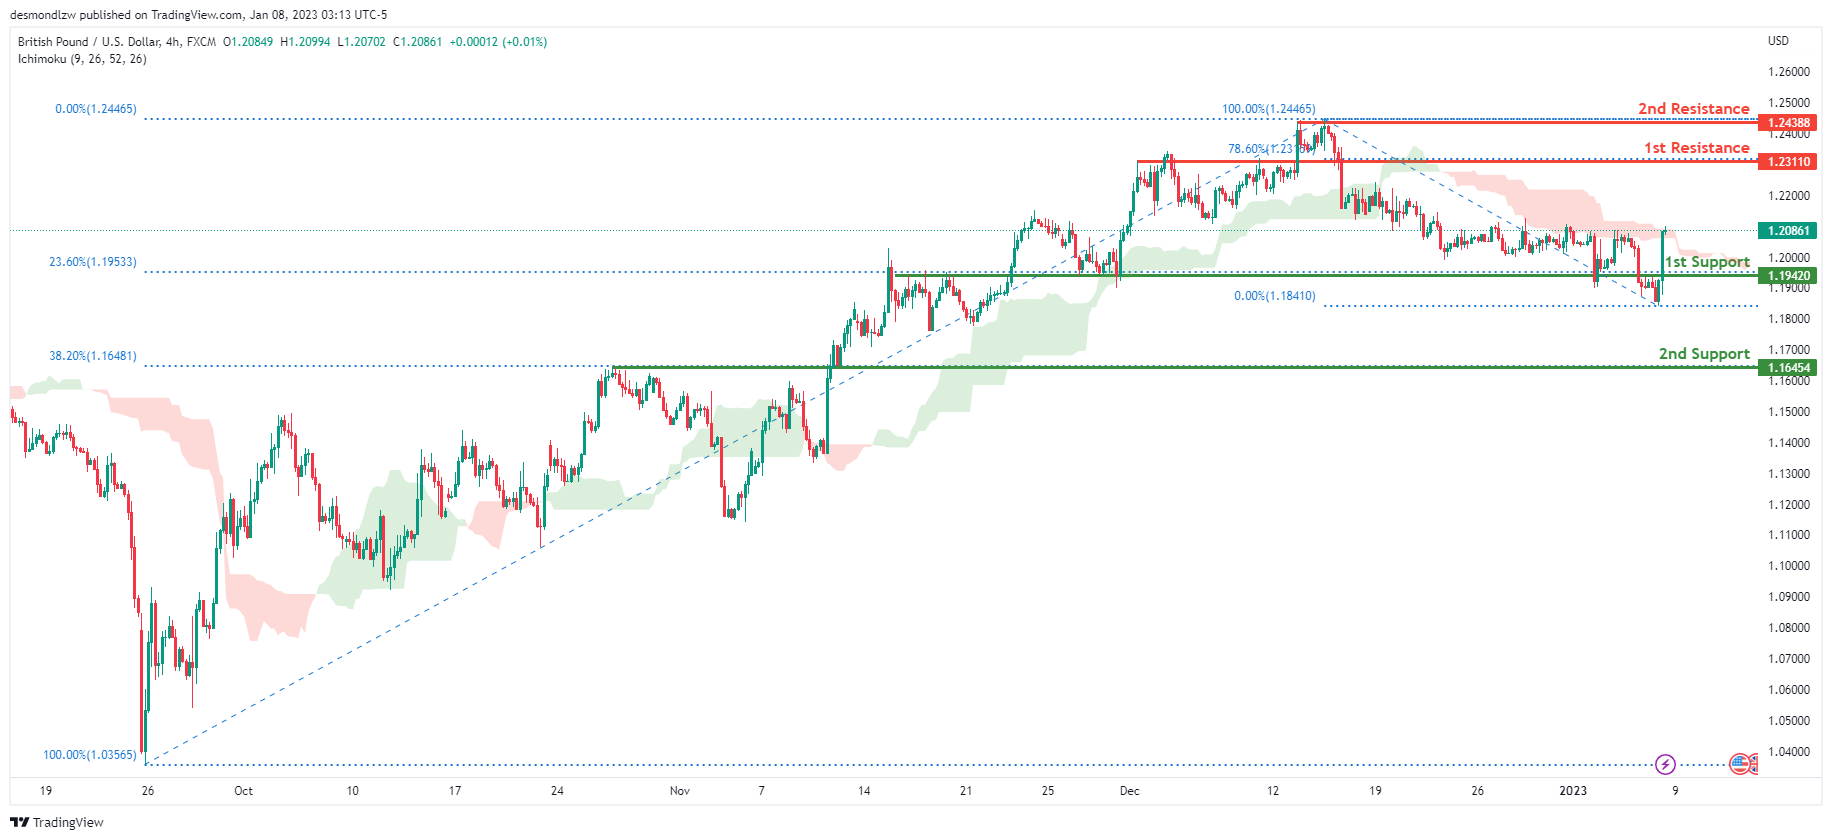
GBP/USD:
Looking at the H4 chart, my overall bias for GBPUSD is bullish due to the current price being above the Ichimoku cloud, indicating a bullish market. If this bullish momentum continues, expect price to possibly continue heading towards the 1st resistance line at 1.23110, where the 78.6% Fibonacci line is. In an alternate scenario, price could possibly head back down towards the 1st support at 1.19420, where the 23.6% Fibonacci line is
Areas of consideration:
- H4 1st resistance at 1.23110
- H4 1st support at 1.19420
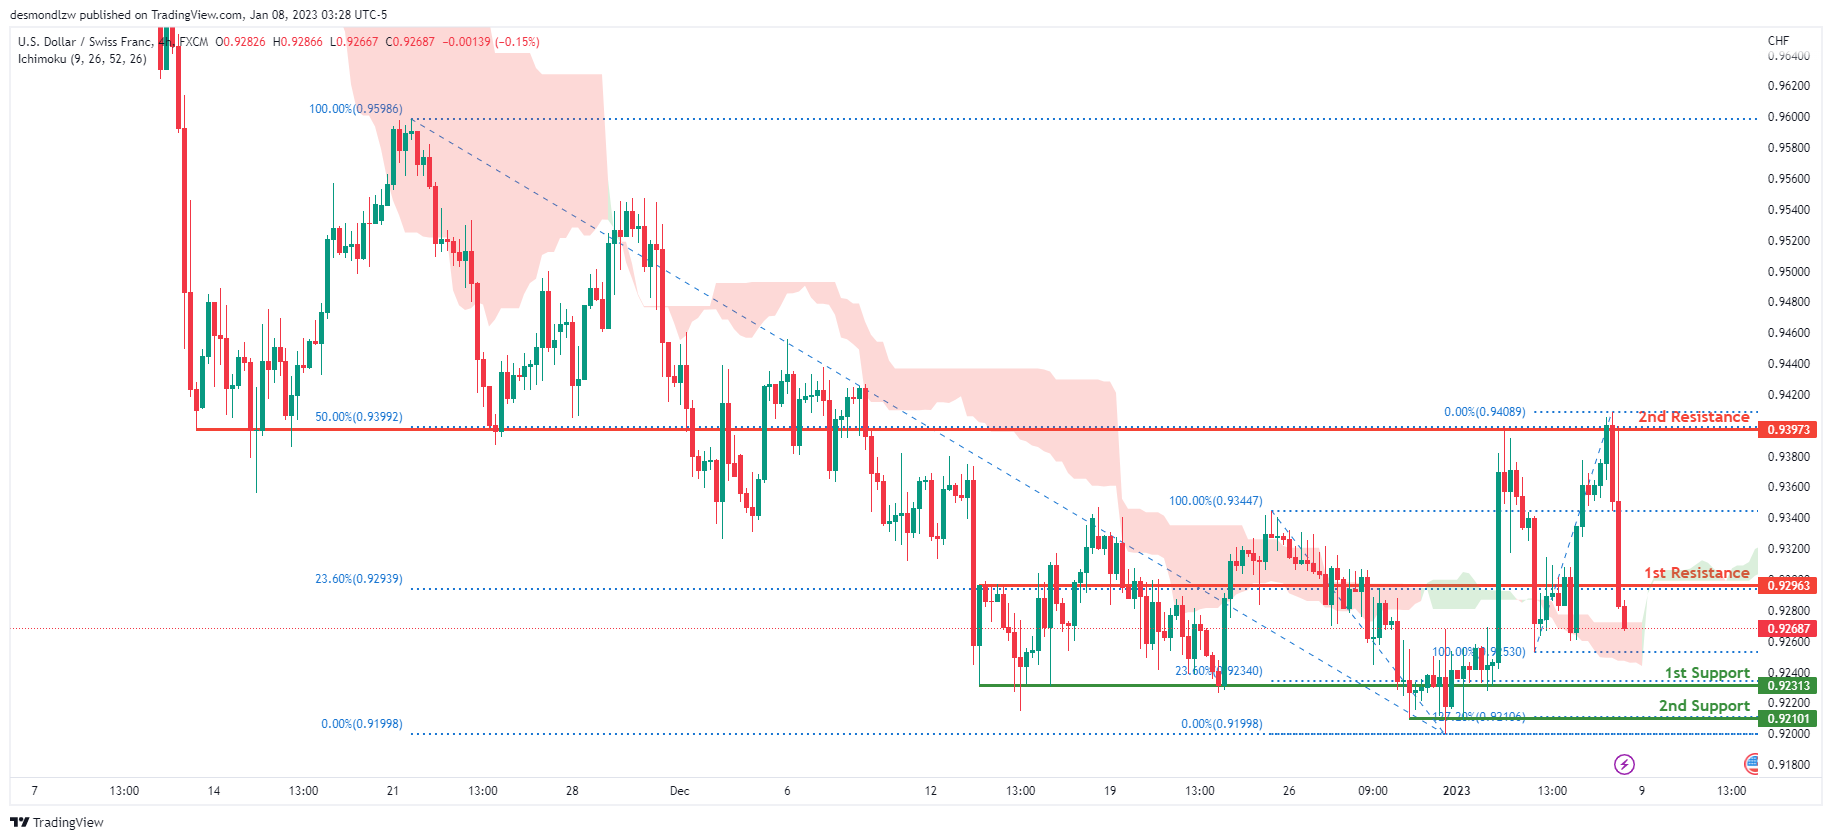
USD/CHF:
Looking at the H4 chart, my overall bias for USDCHF is bearish due to the current price being below the Ichimoku cloud, indicating a bearish market. If the current bearish trend continues, expect the price to head towards the 1st support at 0.92313, where the 23.6% Fibonacci line is. In an alternative scenario, price could possibly head back up to retest the 1st resistance at 0.92963, where the 23.6% Fibonacci line is.
Areas of consideration
- H4 1st support at 0.92313
- H4 1st resistance at 0.92963
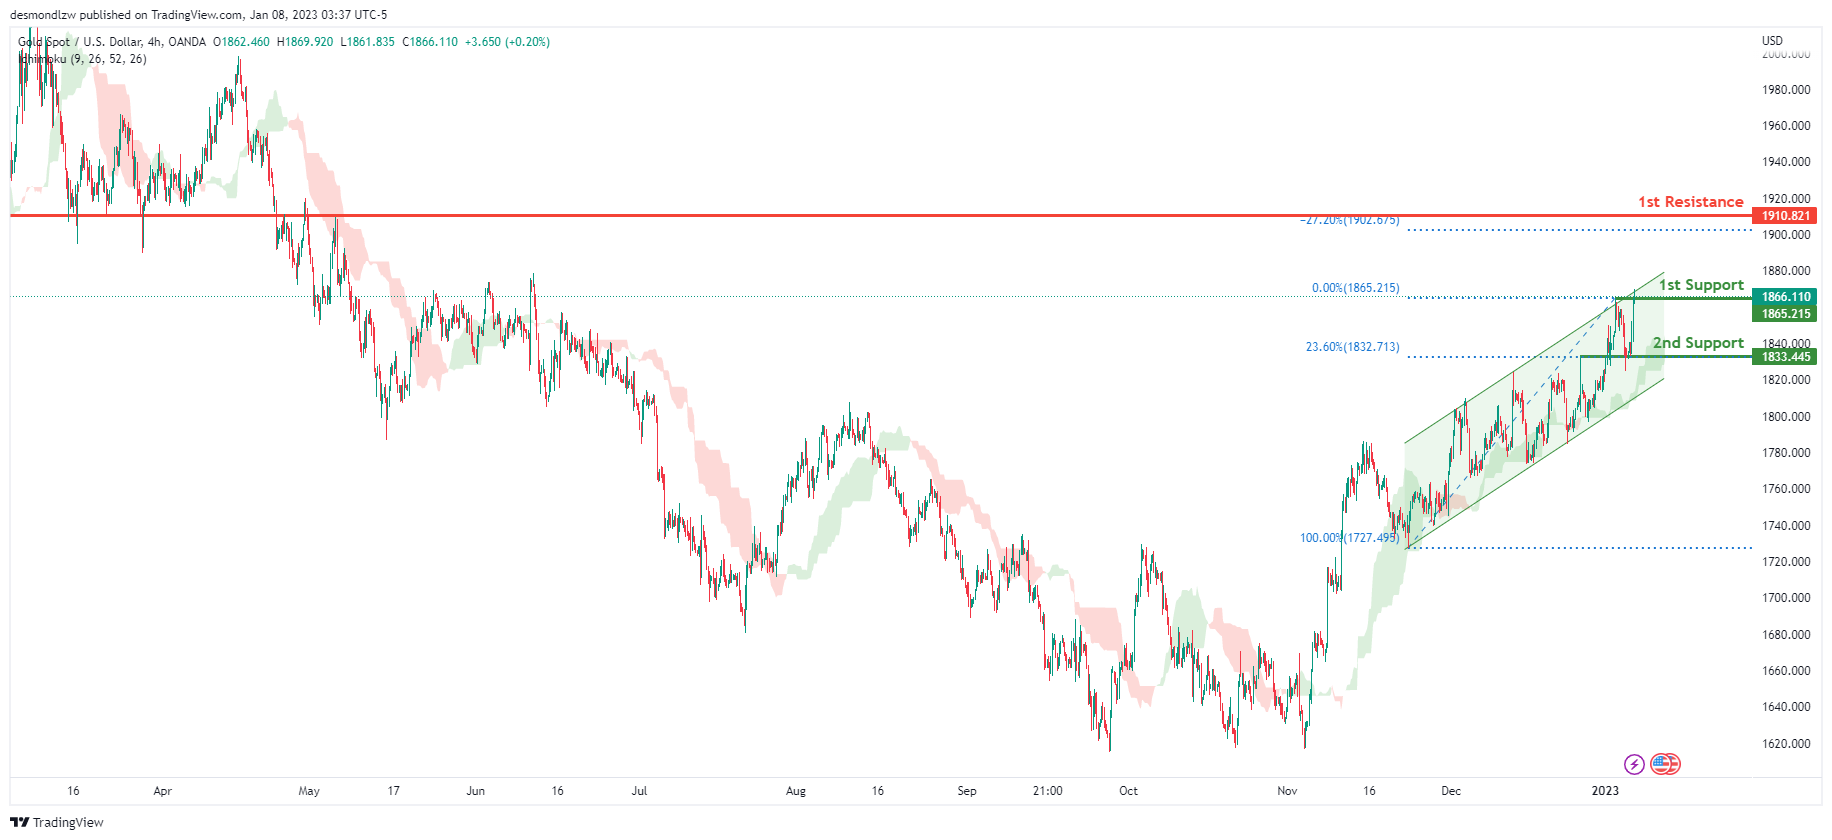
XAU/USD (GOLD):
Looking at the H4 chart, my overall bias for XAUUSD is bullish due to the current price crossing above the Ichimoku cloud, indicating a bullish market. To add support to this bias, price is also within a bullish ascending channel. If this bullish momentum continues, expect the price to possibly continue heading towards the 1st resistance at 1910.821 where the -27.2% Fibonacci expansion line is. In an alternative scenario, price could possibly head back down breaking the 1st support at 1833.445, where the 23.6% Fibonacci line is, before heading towards the 2nd support at 1833.445, where the 23.6% Fibonacci line is.
Areas of consideration:
- H4 time frame, 1st resistance at 1910.821
- H4 time frame, 1st support at 1810.010
- H4 time frame, 2nd support at 1833.445
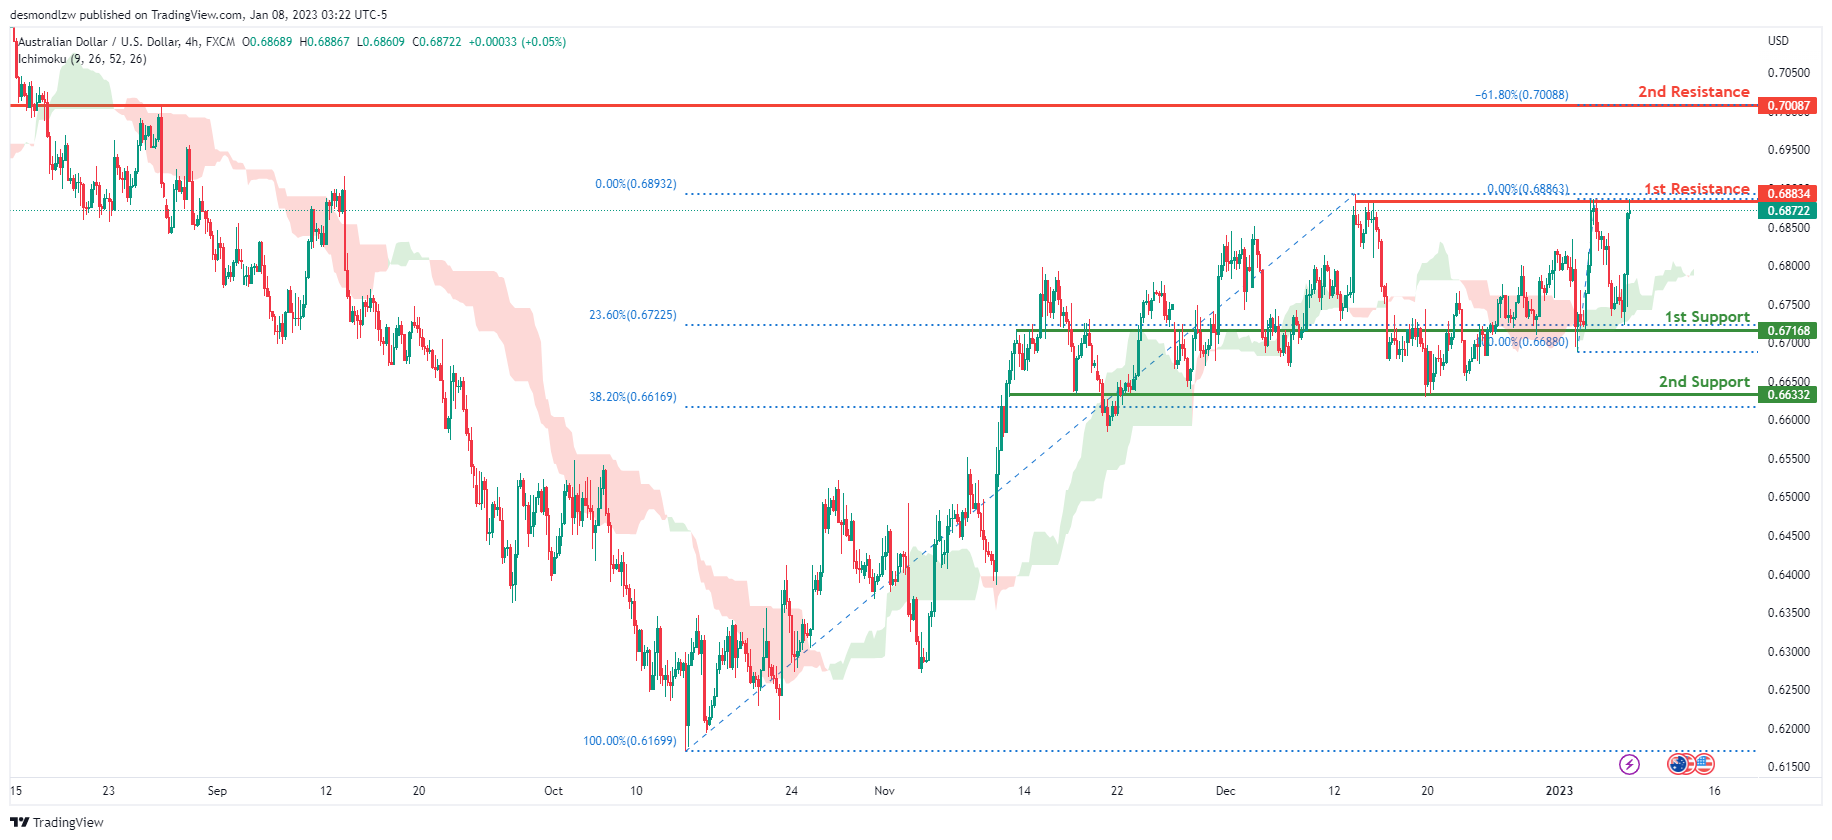
AUD/USD:
Looking at the H4 chart, my overall bias for AUDUSD is bullish due to the current price being above the Ichimoku cloud, indicating a bullish market. If this bullish momentum continues, expect the price to possibly break the 1st resistance at 0.68834, where the recent swing high is, before heading towards the 2nd resistance at 0.70087, where the -61.8% Fibonacci expansion line is. In an alternative scenario, price could possibly head back down breaking the 1st support at 0.67168, where the 23.6% Fibonacci line is, before heading towards the 2nd support at 0.66332, where the 38.2% Fibonacci line is.
Areas of consideration
- H4, 1st resistance at 0.68932
- H4, 2nd resistance at 0.70087
- H4, 1st support at 0.67168
- H4, 2nd support at 0.66332
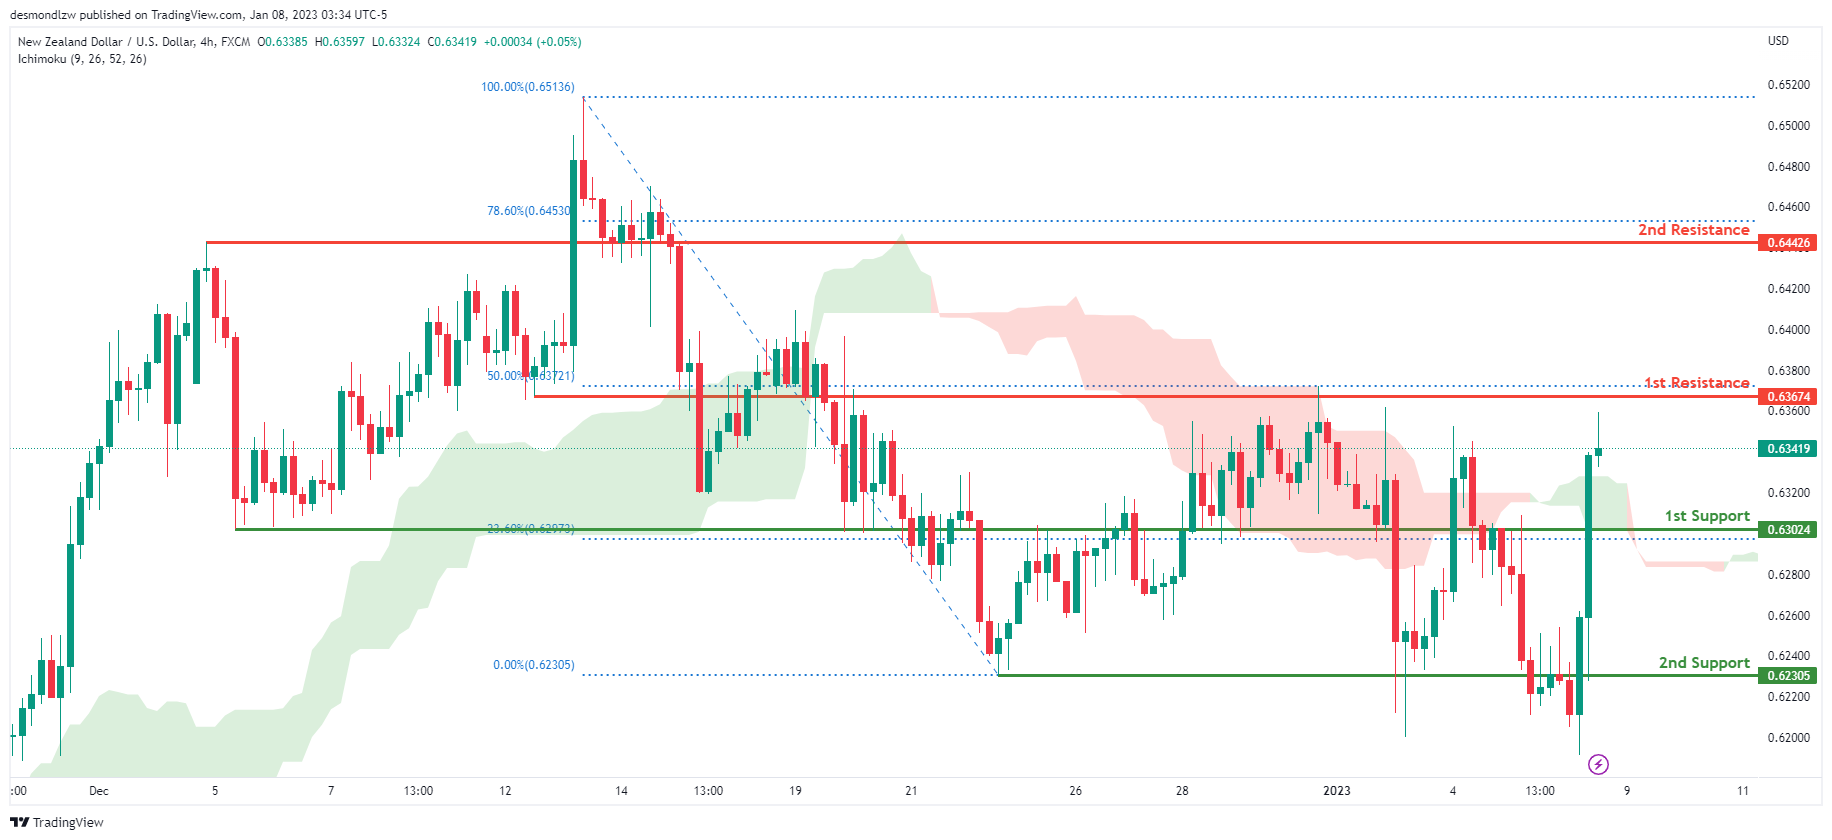
NZD/USD:
Looking at the H4 chart, my overall bias for NZDUSD is bullish due to the current price being above the Ichimoku cloud, indicating a bullish market. If this bullish momentum continues, expect price to possibly continue heading towards the 1st resistance at 0.63674, where the 50% Fibonacci line is. In an alternate scenario, price could possibly head back down to retest the 1st support at 0.63024, where the 23.6% Fibonacci line is
Areas of consideration:
- H4 time frame, 1st resistance at 0.63674
- H4 time frame, 1st support at 0.63024
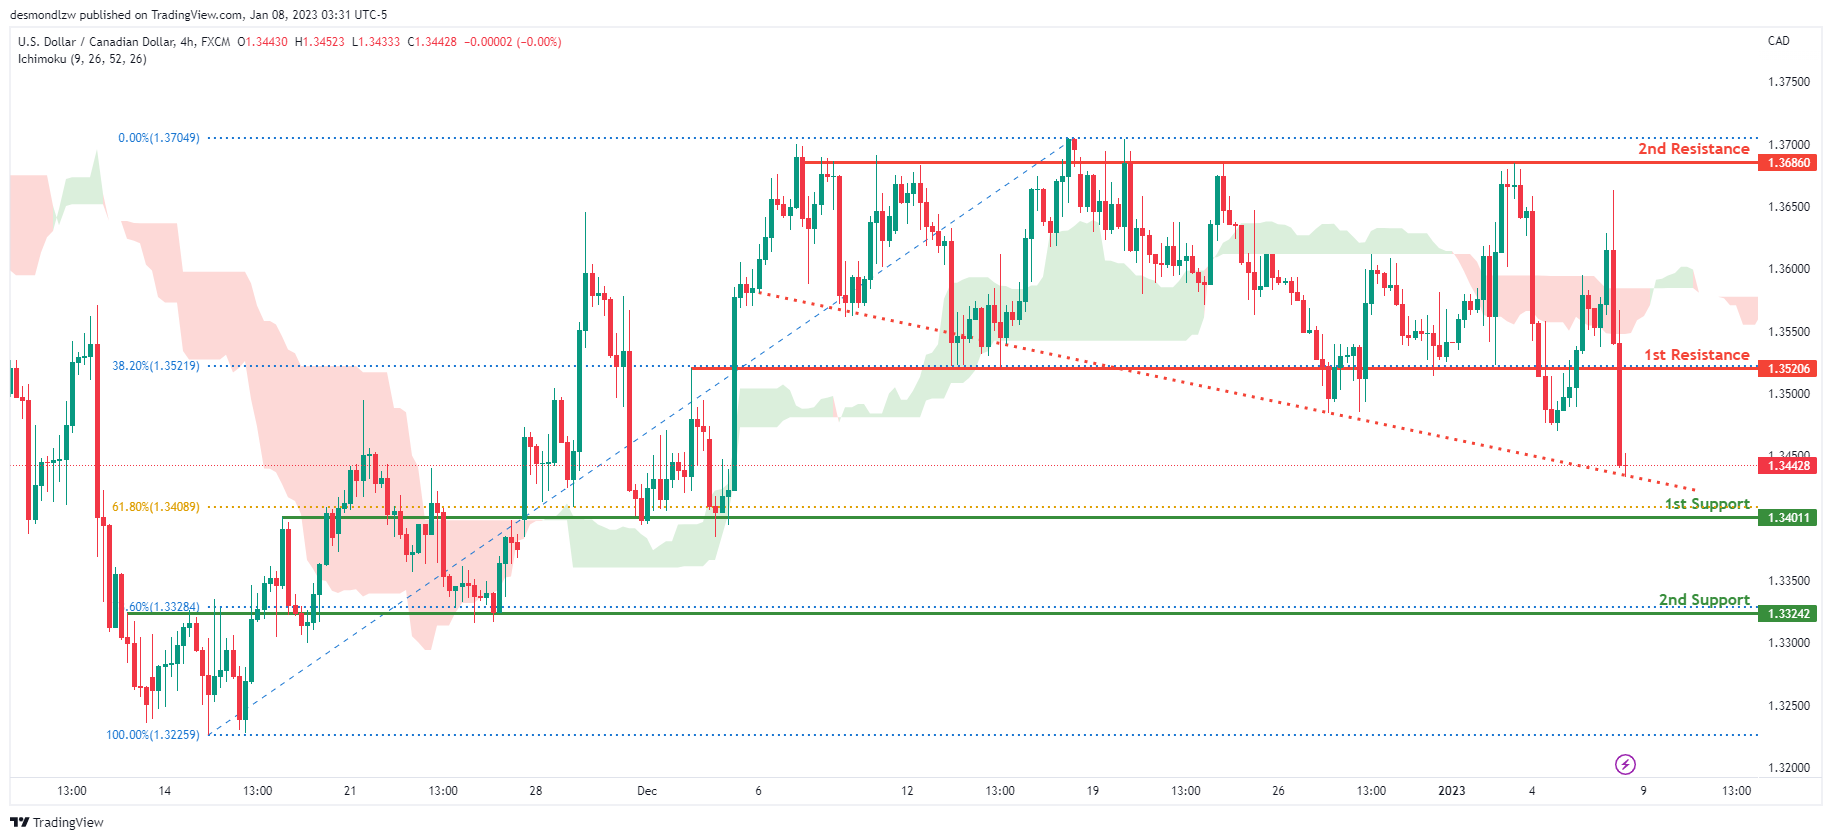
USD/CAD:
On the H4 chart, the overall bias for USDCAD is bearish. To add confluence to this, the price is below the Ichimoku cloud which indicates a bearish market. To add support to this bias, price is also along a descending trendline. If this bearish momentum continues, expect the price to possibly head towards the 1st support at 1.34011, where the 61.8% Fibonacci line is. In an alternative scenario, price could head back up to retest the 1st resistance at 1.35206, where the 38.2% Fibonacci line is.
Areas of consideration:
- H4 time frame, 1st resistance at 1.35206
- H4 time frame, 1st support at 1.34011
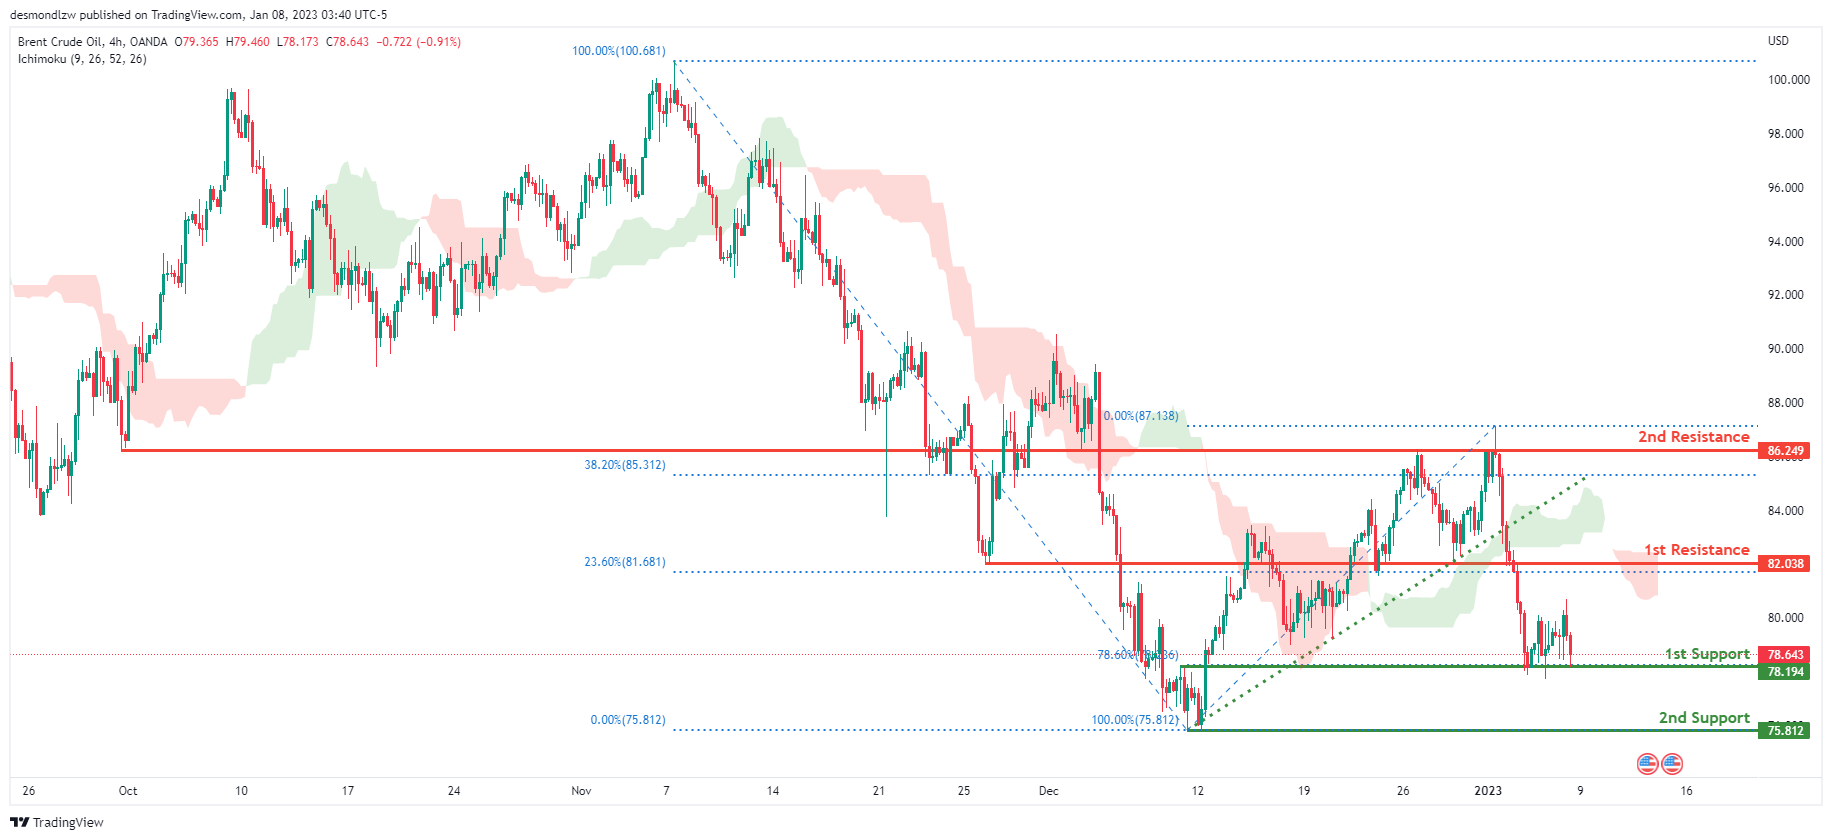
OIL:
Looking at the H4 chart, my overall bias for BCOUSD is bearish due to the current price crossing below the Ichimoku cloud, indicating a bearish market. Adding more confluence to this bias, price has also broken the ascending trend line. If this bearish momentum continues, expect the price to possibly break the 1st support at 78.194, where the 78.6% Fibonacci line is before heading towards the 2nd support at 75.812, where the previous swing low is. In an alternate scenario, price could possibly head back up to retest the 1st resistance at 82.038, where the 23.6% Fibonacci line is
Areas of consideration:
- H4 time frame, 1st resistance at 82.038
- H4 time frame, 1st support at 78.194
- H4 time frame, 2nd support at 75.812
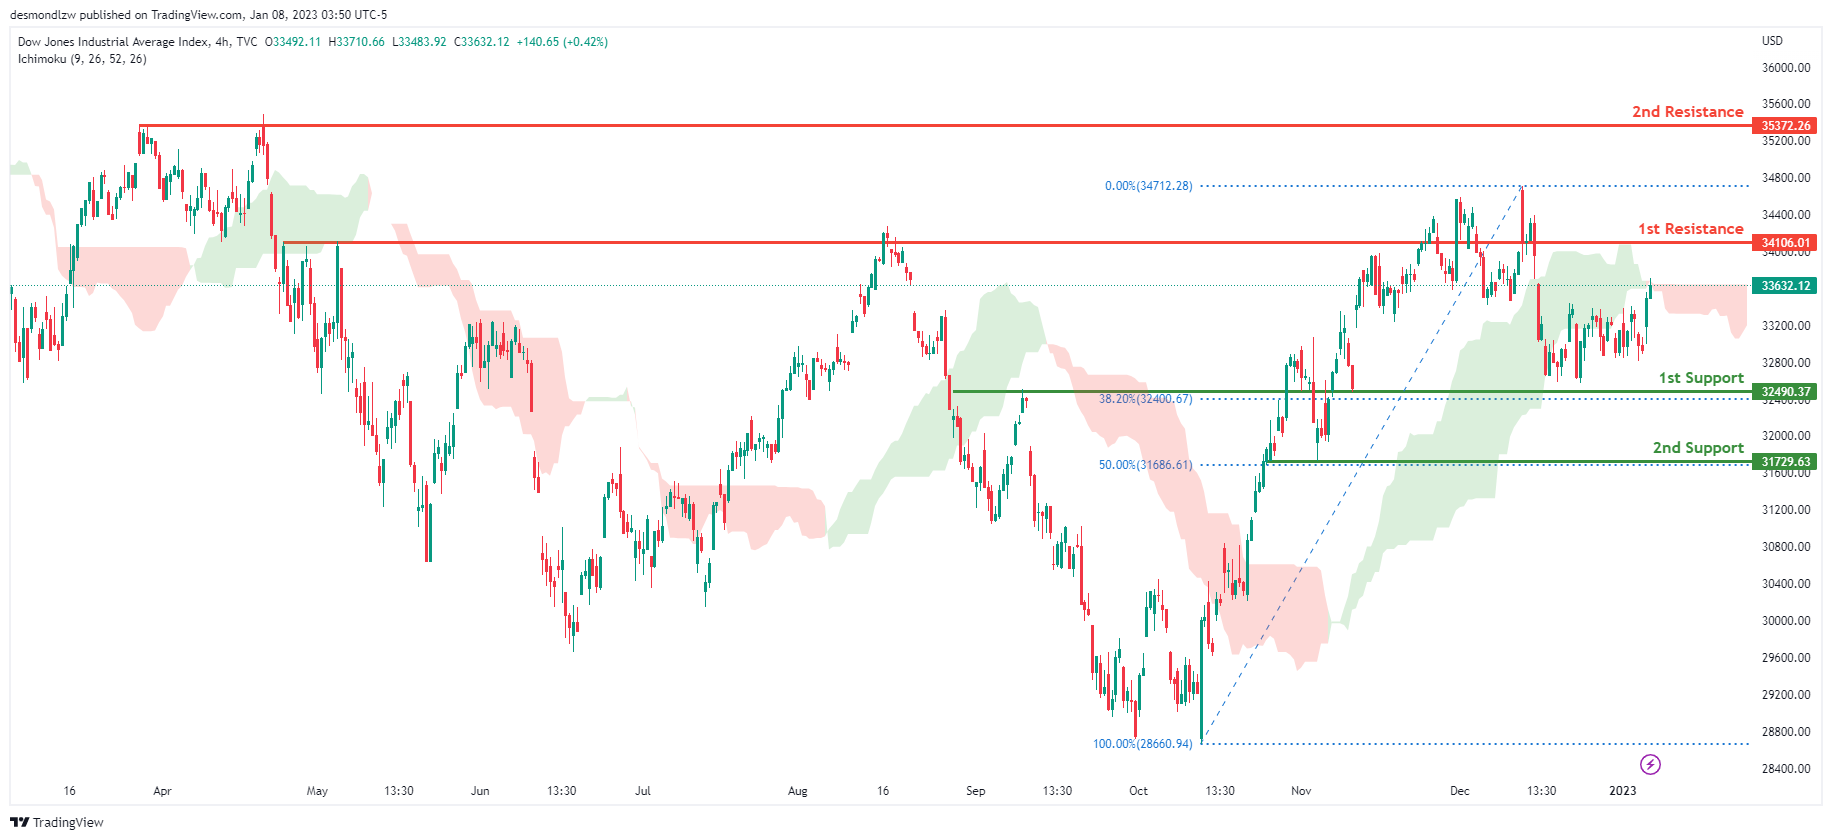
Dow Jones Industrial Average:
On the H4 chart, the overall bias for DJI is bearish. To add confluence to this, the price is crossing below the Ichimoku cloud which indicates a bearish market. If this bearish momentum continues, expect the price to head back down towards the 1st support at 32490.37, where the 61.8% Fibonacci line is. In an alternative scenario, price could possibly break the 1st resistance line at 34106.01, where the previous swing high is before heading towards the 2nd resistance line at 35492.22, where the previous swing high is.
Areas of consideration:
- H4 time frame, 1st support at 32490.37
- H4 time frame, 1st Resistance at 34106.01
- H4 time frame, 2nd Resistance at 35492.22
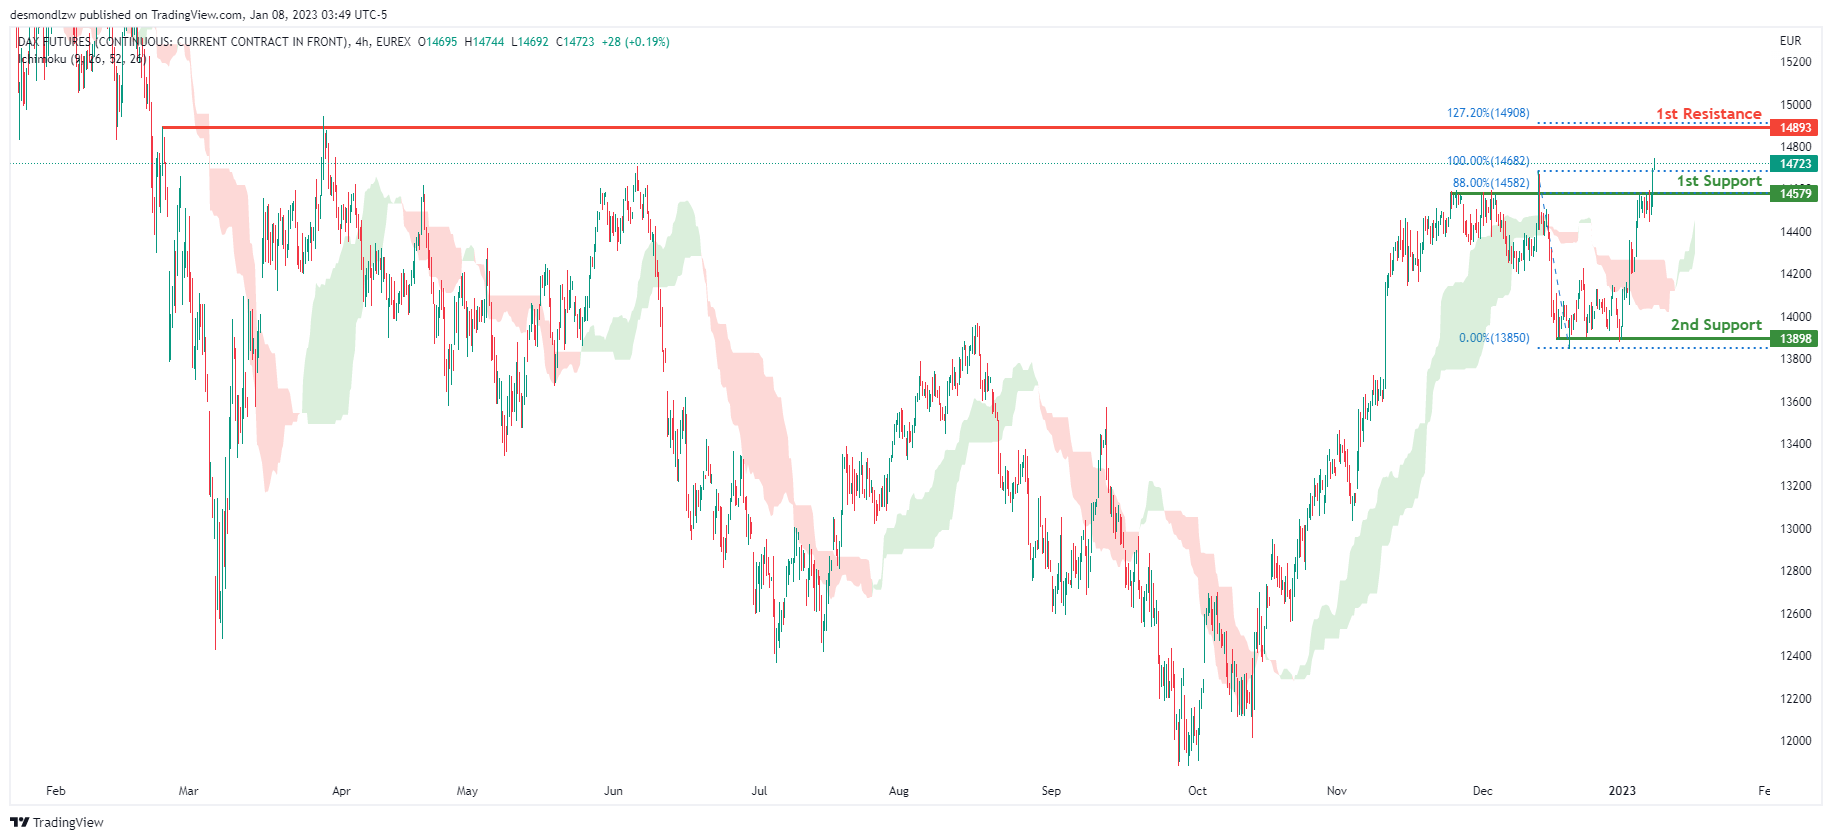
DAX:
Looking at the H4 chart, my overall bias for DAX is bullish due to the current price crossing above the Ichimoku cloud, indicating a bullish market. If this bullish momentum continues, expect the price to possibly head towards the 1st resistance line at 14893, where the 127.2% Fibonacci extension line is. In an alternative scenario, price could possibly head down to retest the 1st support at 14579, where the 88% Fibonacci line is.
Areas of consideration:
- H4 time frame, 1st resistance is at 14893
- H4 time frame, 1st support is at 14579
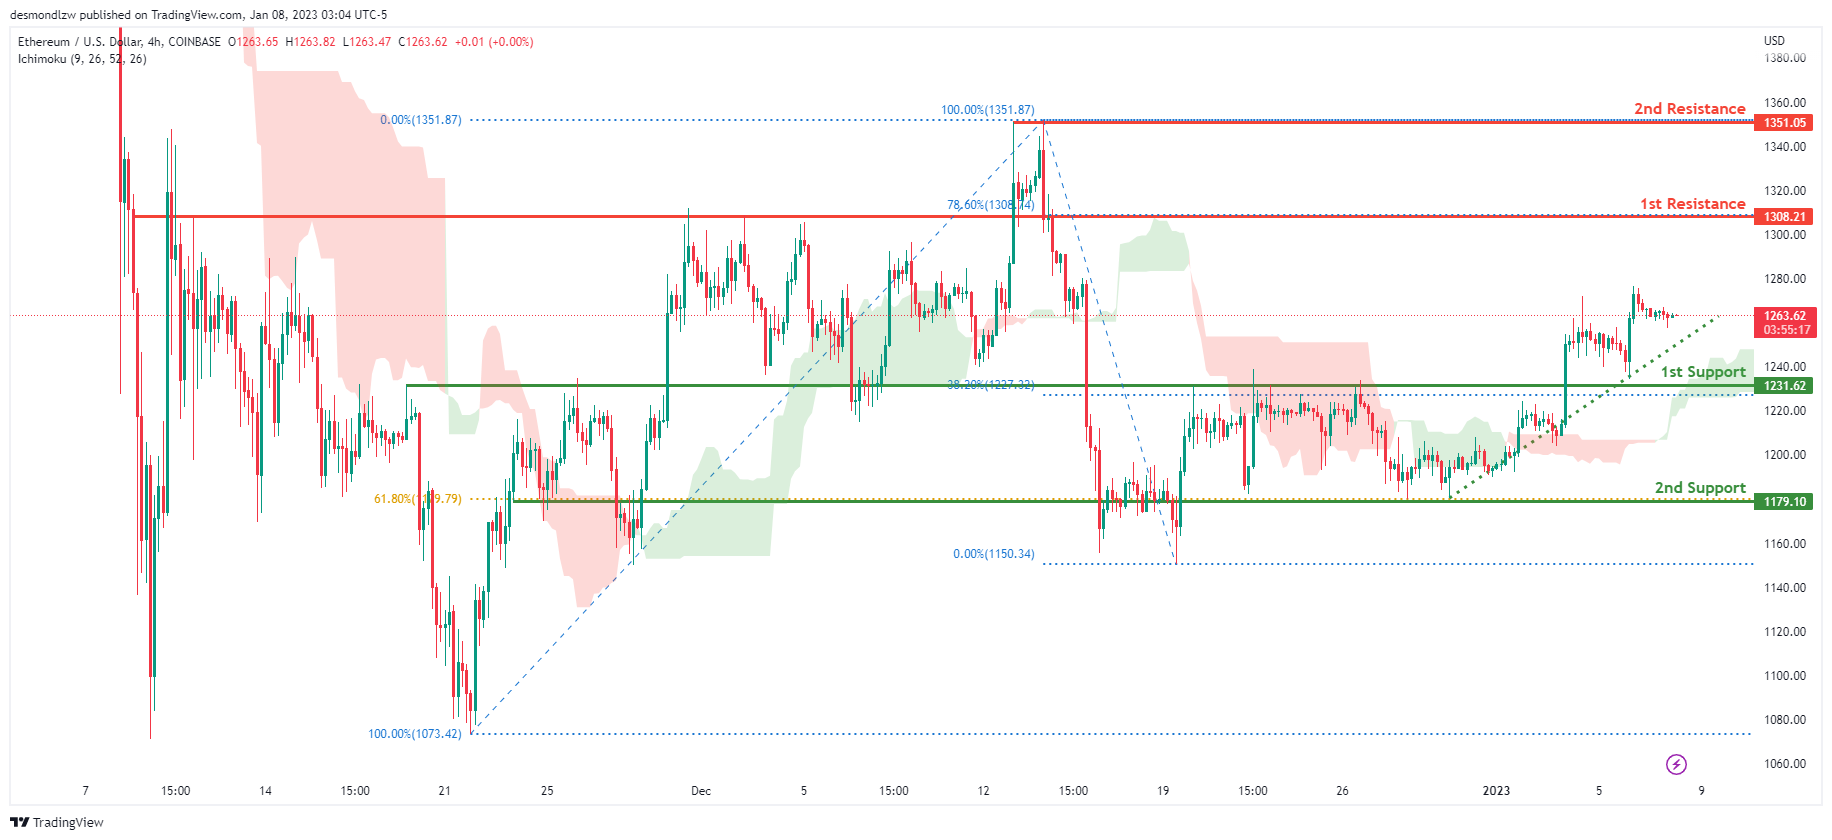
ETHUSD:
Looking at the H4 chart, my overall bias for ETHUSD is bullish due to the current price crossing above the Ichimoku cloud, indicating a bullish market. To add support to this bias, price is also climbing along an ascending trendline. If this bullish momentum continues, expect the price to head towards the 1st resistance at 1308.21, where the 78.6% Fibonacci line is. In an alternative scenario, price could head back down to retest the 1st support at 1231.62, where the 38.2% Fibonacci line is.
Areas of consideration:
- H4 time frame, 1st resistance of 1308.21
- H4 time frame, 1st support at 1231.62
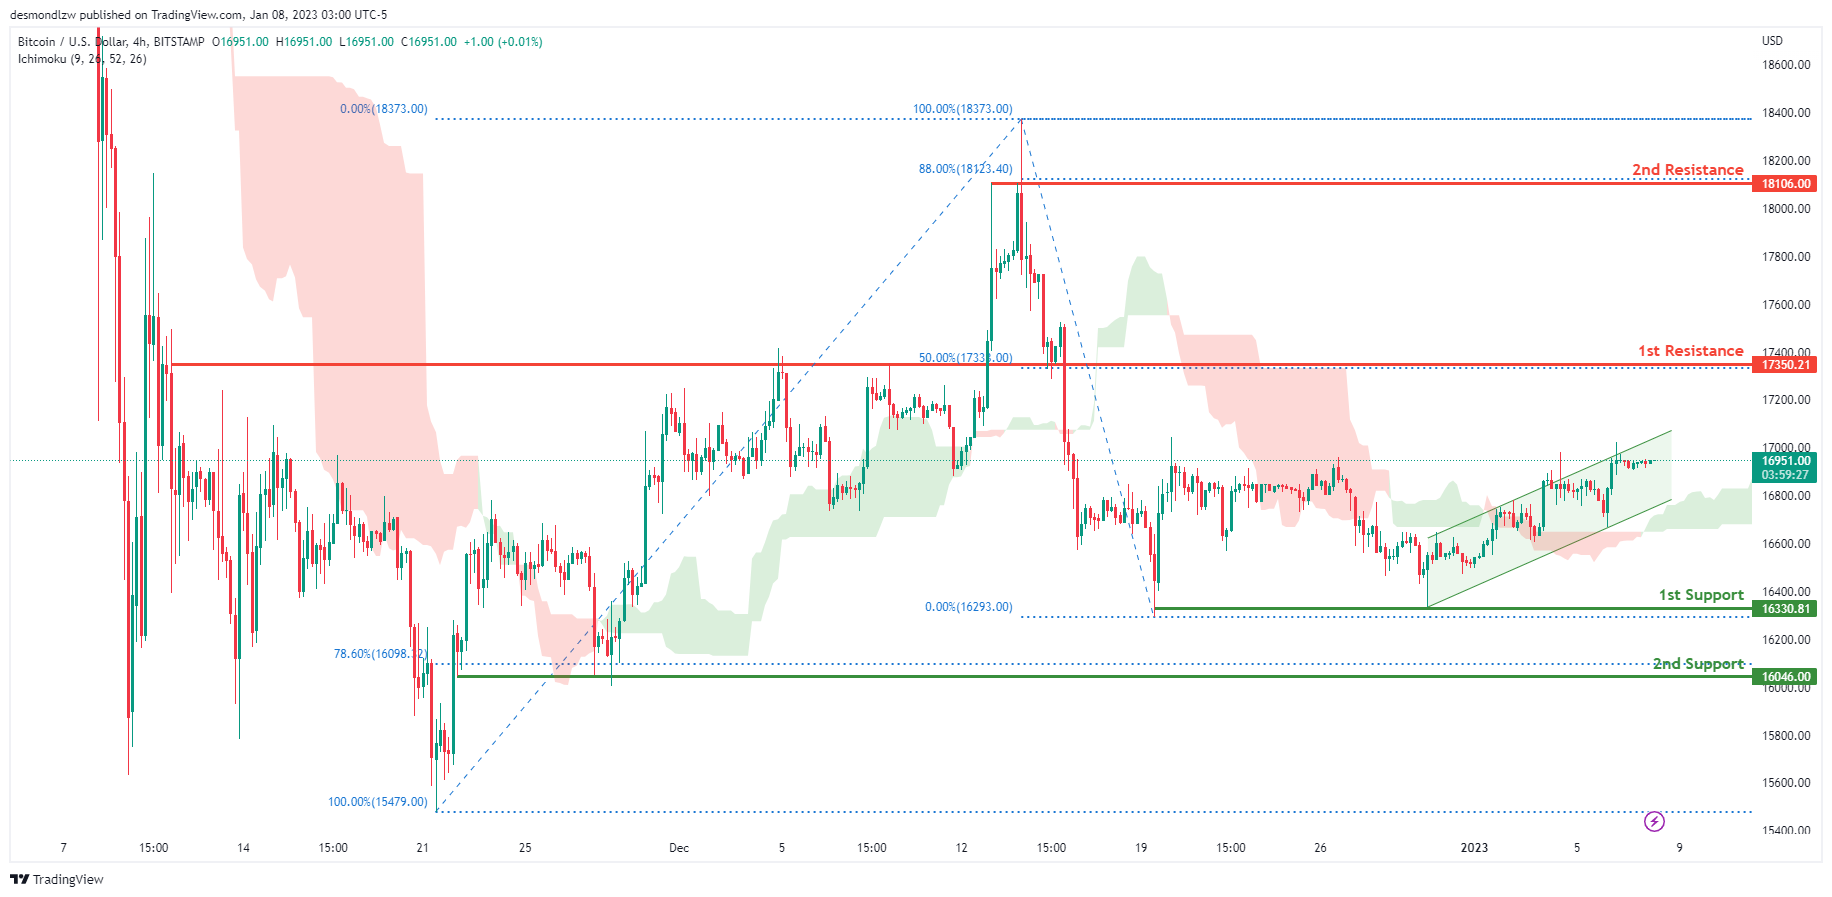
BTCUSD:
Looking at the H4 chart, my overall bias for BTCUSD is bullish due to the current price being above the Ichimoku cloud, indicating a bullish market. To add support to this bias, price is also within a bullish ascending channel. If this bullish momentum continues, expect the price to possibly continue heading towards the 1st resistance at 17350.21, where the 50% Fibonacci line is. In an alternative scenario, price could possibly head back down towards the 1st support at 16330.81, where the recent low and liquidity hotspot are.
Areas of consideration:
- H4 time frame, 1st resistance 17350.21
- H4 time frame, 1st support at 16330.81
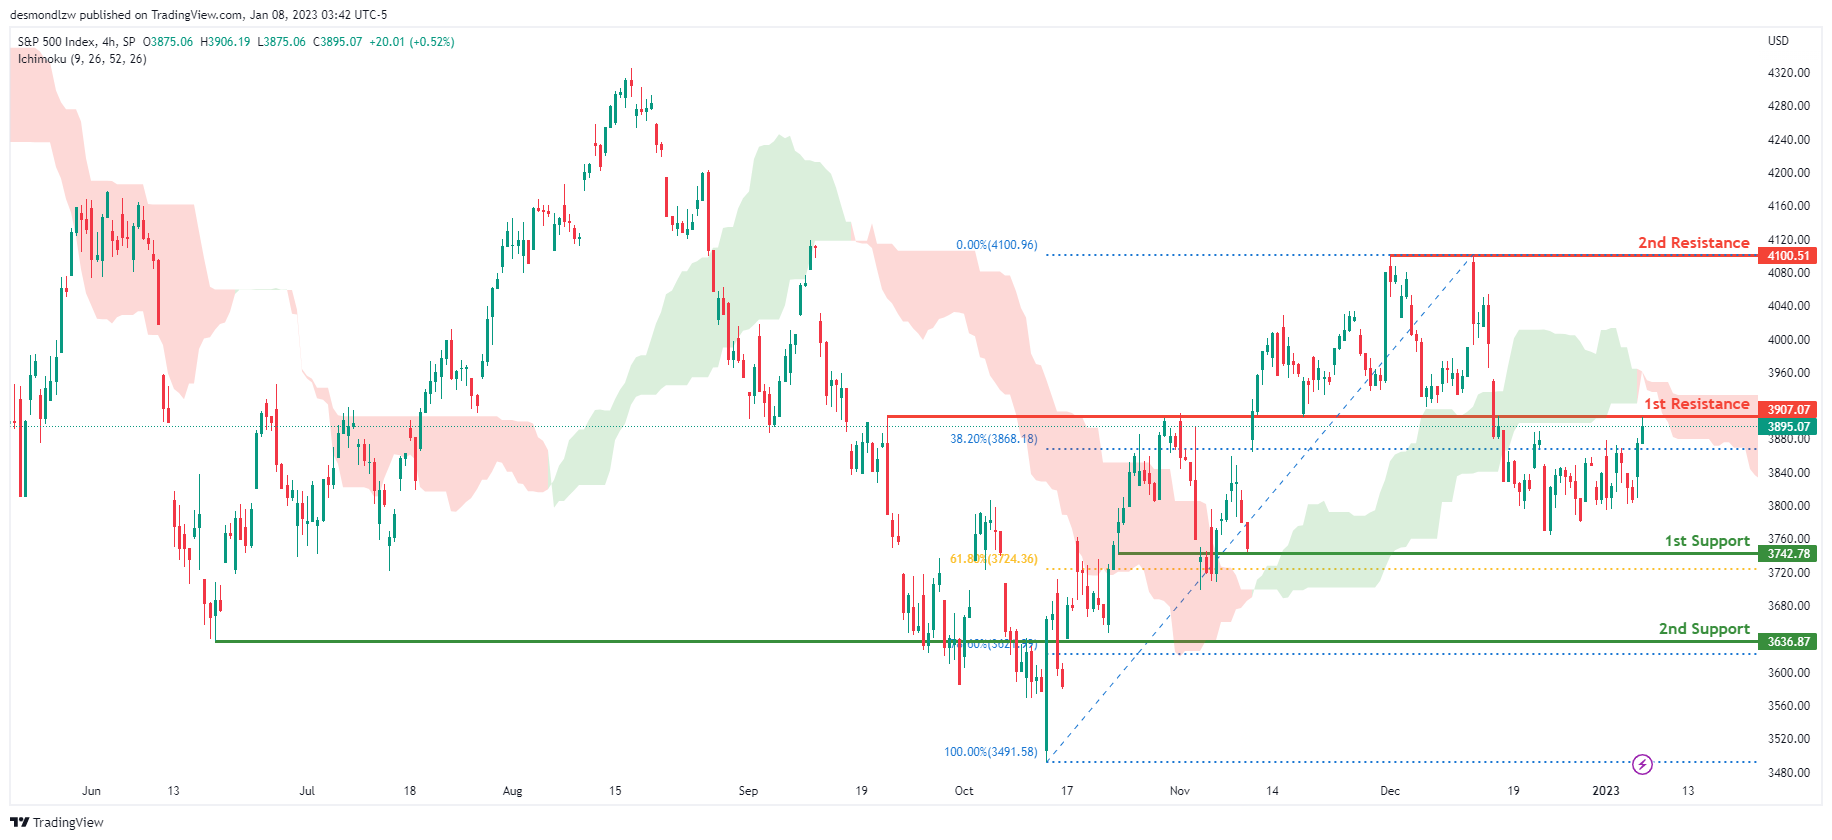
S&P 500:
Looking at the H4 chart, my overall bias for S&P500 is bearish due to the current price being below the Ichimoku cloud, indicating a bearish market. If this bearish momentum continues, expect the price to continue heading towards the 1st support at 3742.78, where the 61.8% Fibonacci line is. In an alternative scenario, price could possibly head back up to retest the 1st resistance at 3907.07, where the 38.2% Fibonacci line is.
Areas of consideration:
- H4 time frame, 1st support at 3742.78
- H4 time frame, 1st resistance at 3907.07


