
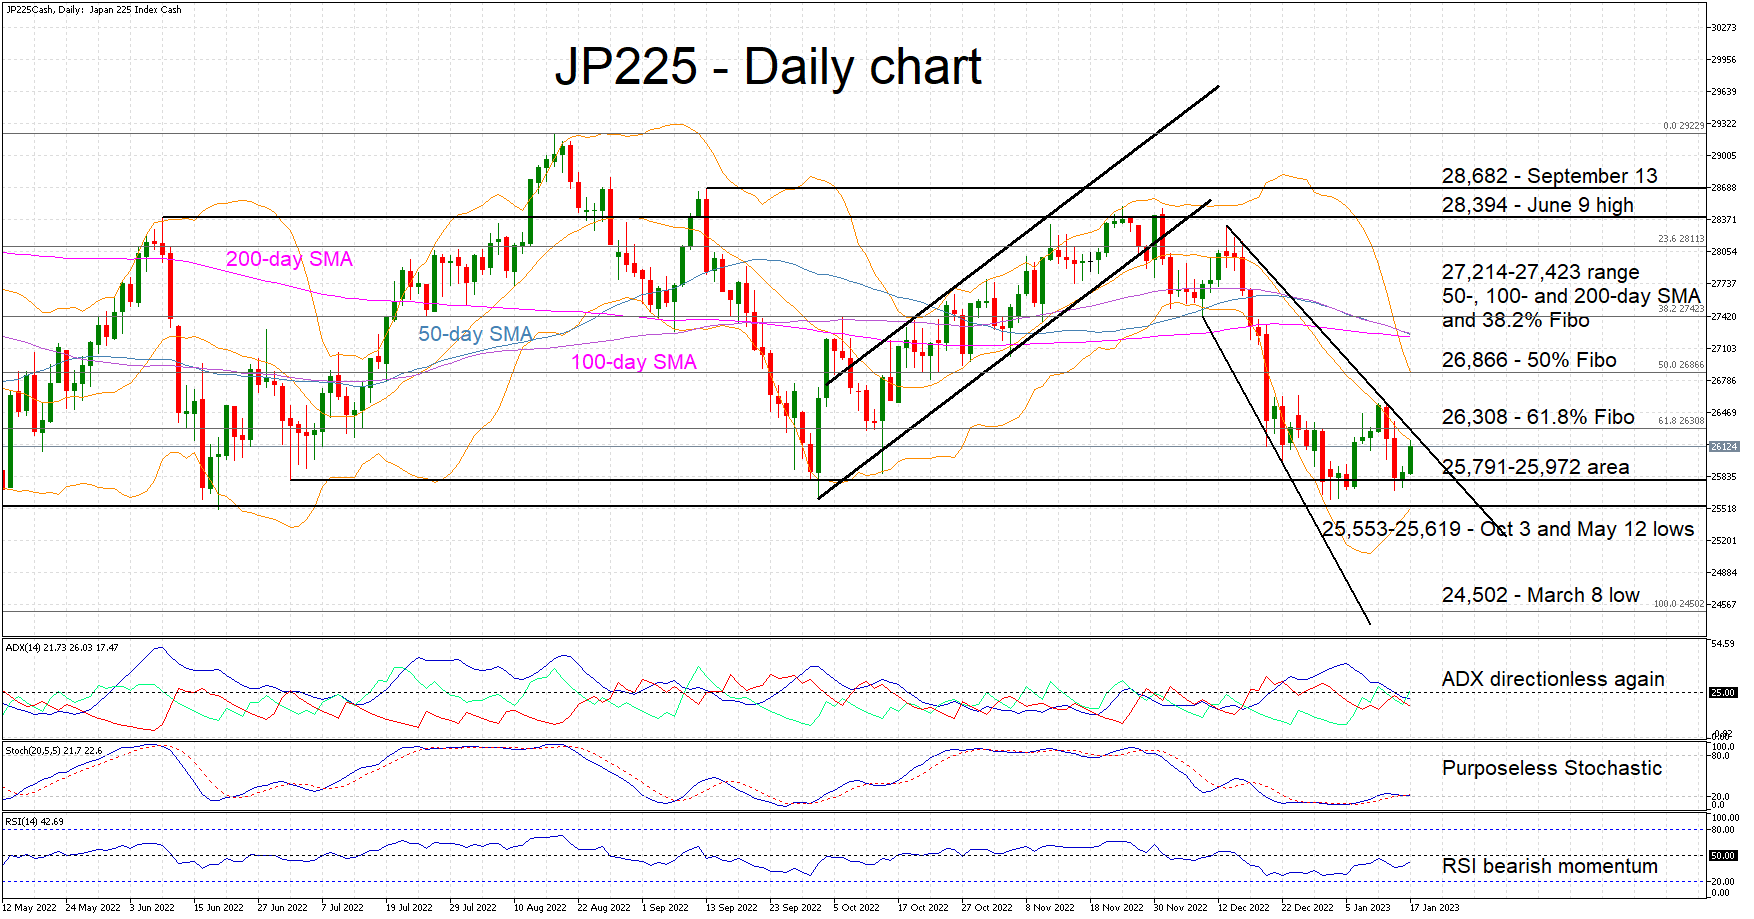
The JP225 cash index has had a muted start in 2023 compared to other equity indices. It is trading in the tight 25,603-26,550 range lacking a clear direction. The Average Directional Movement Index (ADX) is currently trading below 25, confirming a trendless market, while the stochastic oscillator is hovering purposelessly around the 20-level mark.
However, a strong signal appears to be developing in the market. The degree of convergence of the simple moving averages (SMAs) might not go unnoticed by market participants. If one also factors in the developed descending broadening wedge, then there are heightened chances that the JP225 index might be close to trading outside its recent range.
From the bulls’ perspective, the 61.8% Fibonacci retracement level of the March 8 – August 17 uptrend of 26,308 and the December 13 downward trendline are potentially important trigger points. Upon clearing these levels, the next resistance could come at the 50% Fibonacci retracement of 26,866, just ahead of the trifecta of SMAs at the 27,214-27,423 range.
On the other hand, the bears’ first target could come at the July 1 low of 25,791. The 25,553-25,619 range, populated by the October 3 and May 12 lows, could then be on the cards. But the key target appears to be the March 8 low of 24,502.
To conclude, market participants appear undecided as the JP225 cash index trades in a tight range. The convergence of the SMAs and the formed price pattern could force market participants to show their hand.


