
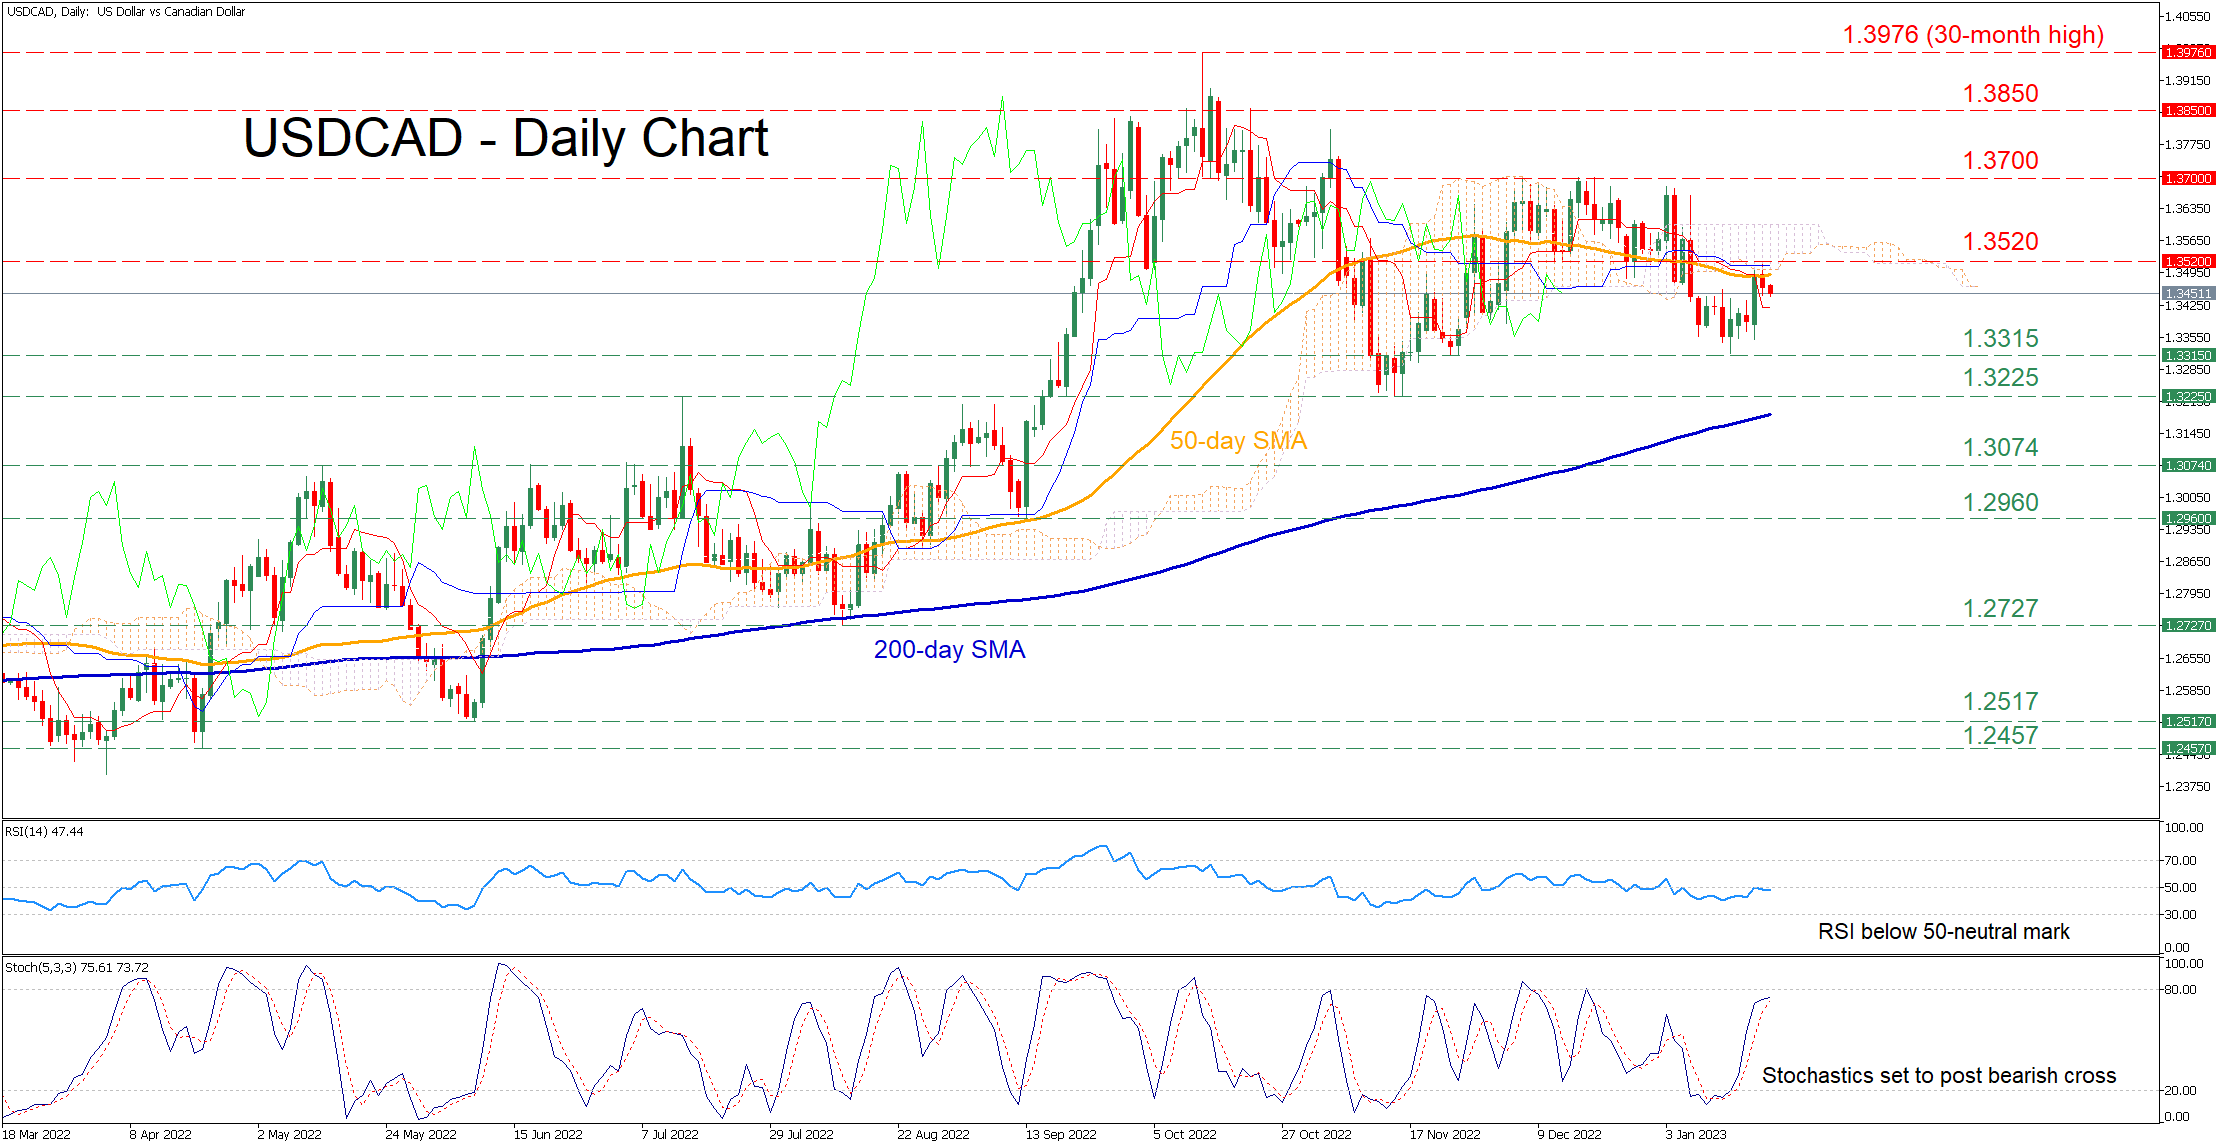
USDCAD had been in an uptrend since March, posting a fresh 30-month high of 1.3976 before experiencing a downside correction. In the short-term, the pair attempted to edge higher after breaking above its sideways pattern, but its advance got rejected at the 50-day simple moving average (SMA).
The momentum indicators currently suggest that near-term risks remain tilted to the downside. Specifically, the RSI has failed to cross above the 50-neutral mark, while the stochastic oscillator is set to post a bearish cross.
Should buying pressures persist, the recent low of 1.3315 could act as immediate support. Violating that zone, the price could test the November bottom of 1.3225. If that floor collapses, the bears may aim for 1.3074 before the 1.2960 support region comes under examination.
Alternatively, if the price manages to cross above the 50-day SMA, initial resistance could be met at the 1.3520 hurdle, which overlaps with the lower boundary of the Ichimoku cloud. Piercing through that wall, the pair might ascend towards 1.3700 or higher to challenge the 1.3850 barrier. A break above the latter could set the stage for the 30-month high of 1.3976.
In brief, USDCAD appears to be held down by the 50-day SMA. Therefore, a successful break above that zone could trigger a moderate rally to the upside.


