
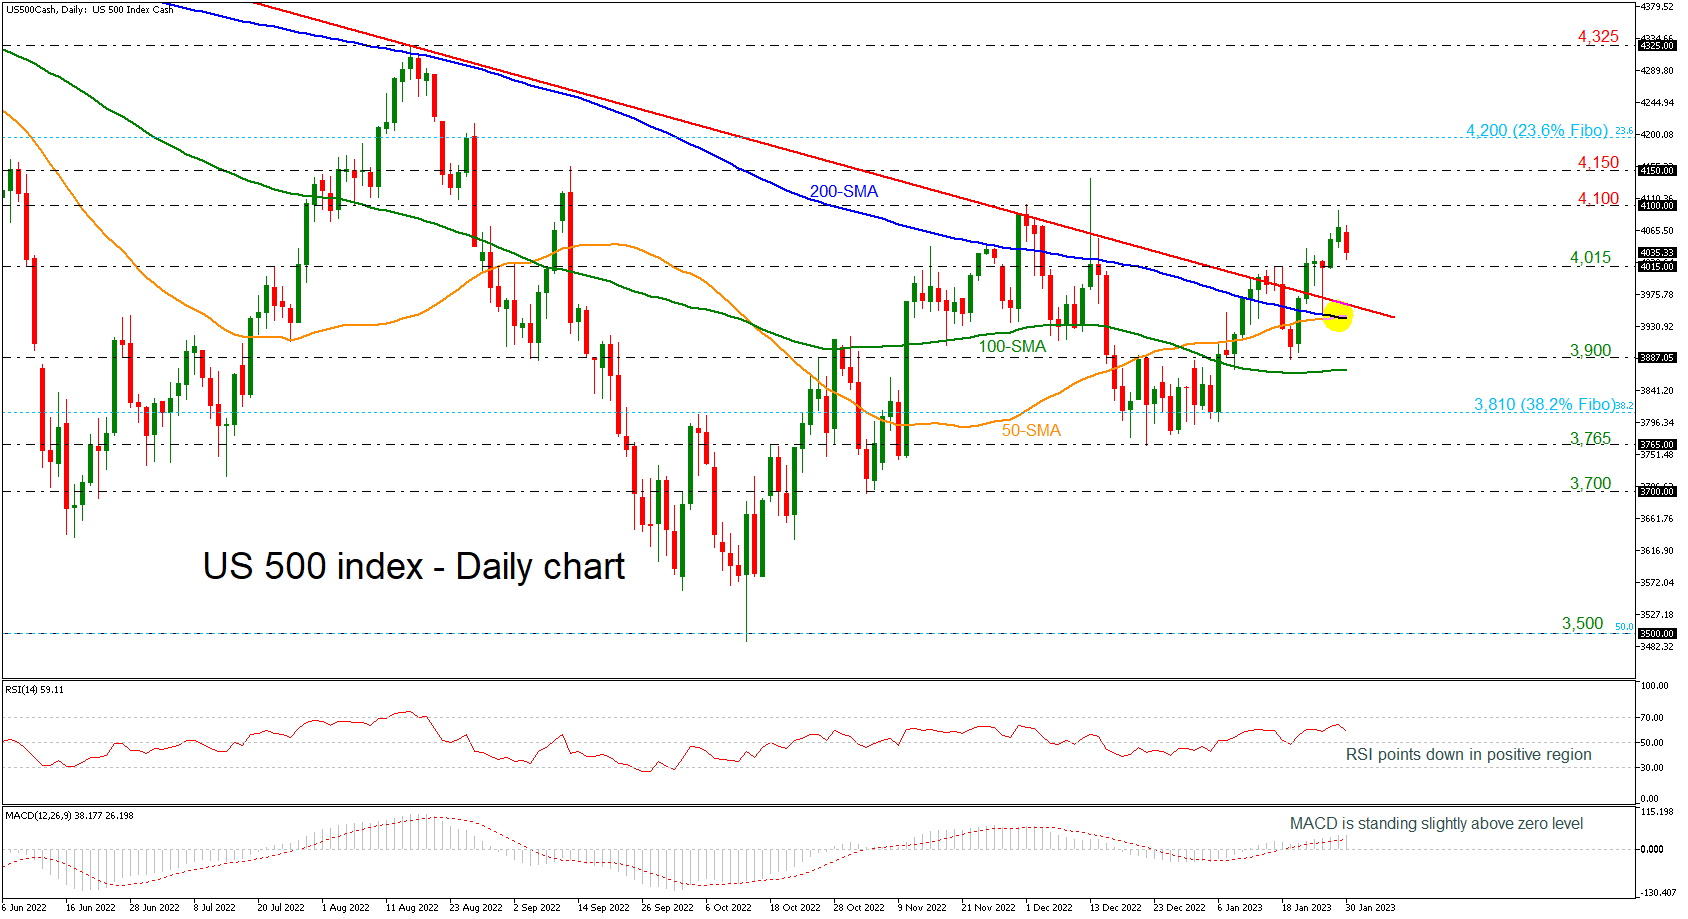
The US 500 stock index is retreating after the successful rally above the long-term downtrend line and the 4,000 round number. Also, the 50- and the 200-day simple moving averages (SMAs) posted a golden cross, but the momentum is weakening as both are moving sideways. The RSI is pointing down in the bullish region; however, the MACD is strengthening its momentum above its trigger and zero lines.
Should the pair manage to strengthen its positive momentum, the next resistance could come around 4,100. A break higher would shift the bias to a more bullish one and open the way towards the 4,150 level and the 23.6% Fibonacci retracement mark of the up leg from 2,180 to 4,810 at 4,200.
However, if prices are unable to break higher, the risk would shift back to the downside, with the 4,015 support and the descending trend line near 3,970 coming into focus. The next key support levels to watch lower down are the 50- and the 200-day SMAs at 3,940 and the 3,900 figure.
In the medium-term, the outlook shifted to positive since prices were above all the moving average lines but any moves beneath the downtrend line would change the bias back to bearish again.


