
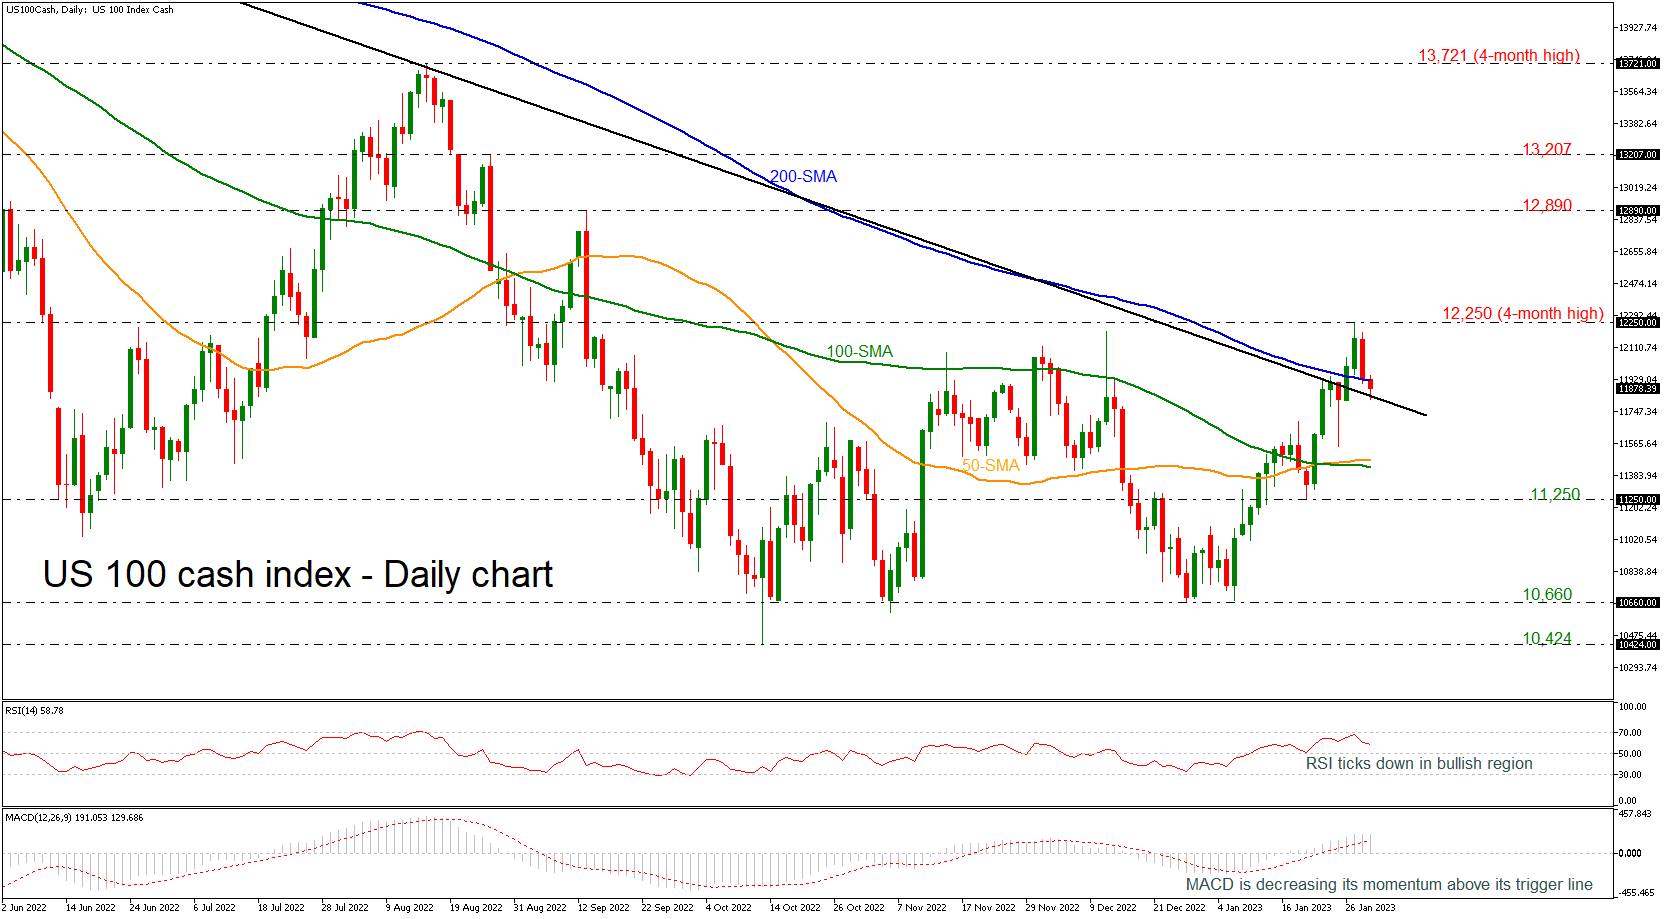
The US 100 cash index reached overbought levels according to the RSI and reversed lower after the price finally jumped above the long-term downtrend line and the 200-day simple moving average (SMA), creating a four-month high at 12,250.
While the aforementioned technical oscillator continues to slow down, mirroring the market’s bearish behavior over the past two days, the indicator is still moving in bullish territory, flagging that a recovery could reemerge in the short term. The MACD is also holding above its red signal line, which supports the bullish view as well, even though it is flattening.
In case the price changes its short-term direction to the upside, the bulls will probably challenge the previous top at 12,250. A break higher could last until 12,890, the high from September 13, ahead of 13,207.
Alternatively, additional declines may drive the price towards the 50- and the 100-day SMAs around 11,452 before the 11,250 support comes into view. Beneath the latter, the 10,660 zone, which rejected the market’s actions recently, could be another level in focus.
Summarizing, the US 100 index maintains a bullish bias in the medium-term picture after the bounce off 10,660 but any moves beneath the downtrend line could confirm the long-term negative mode again.


