
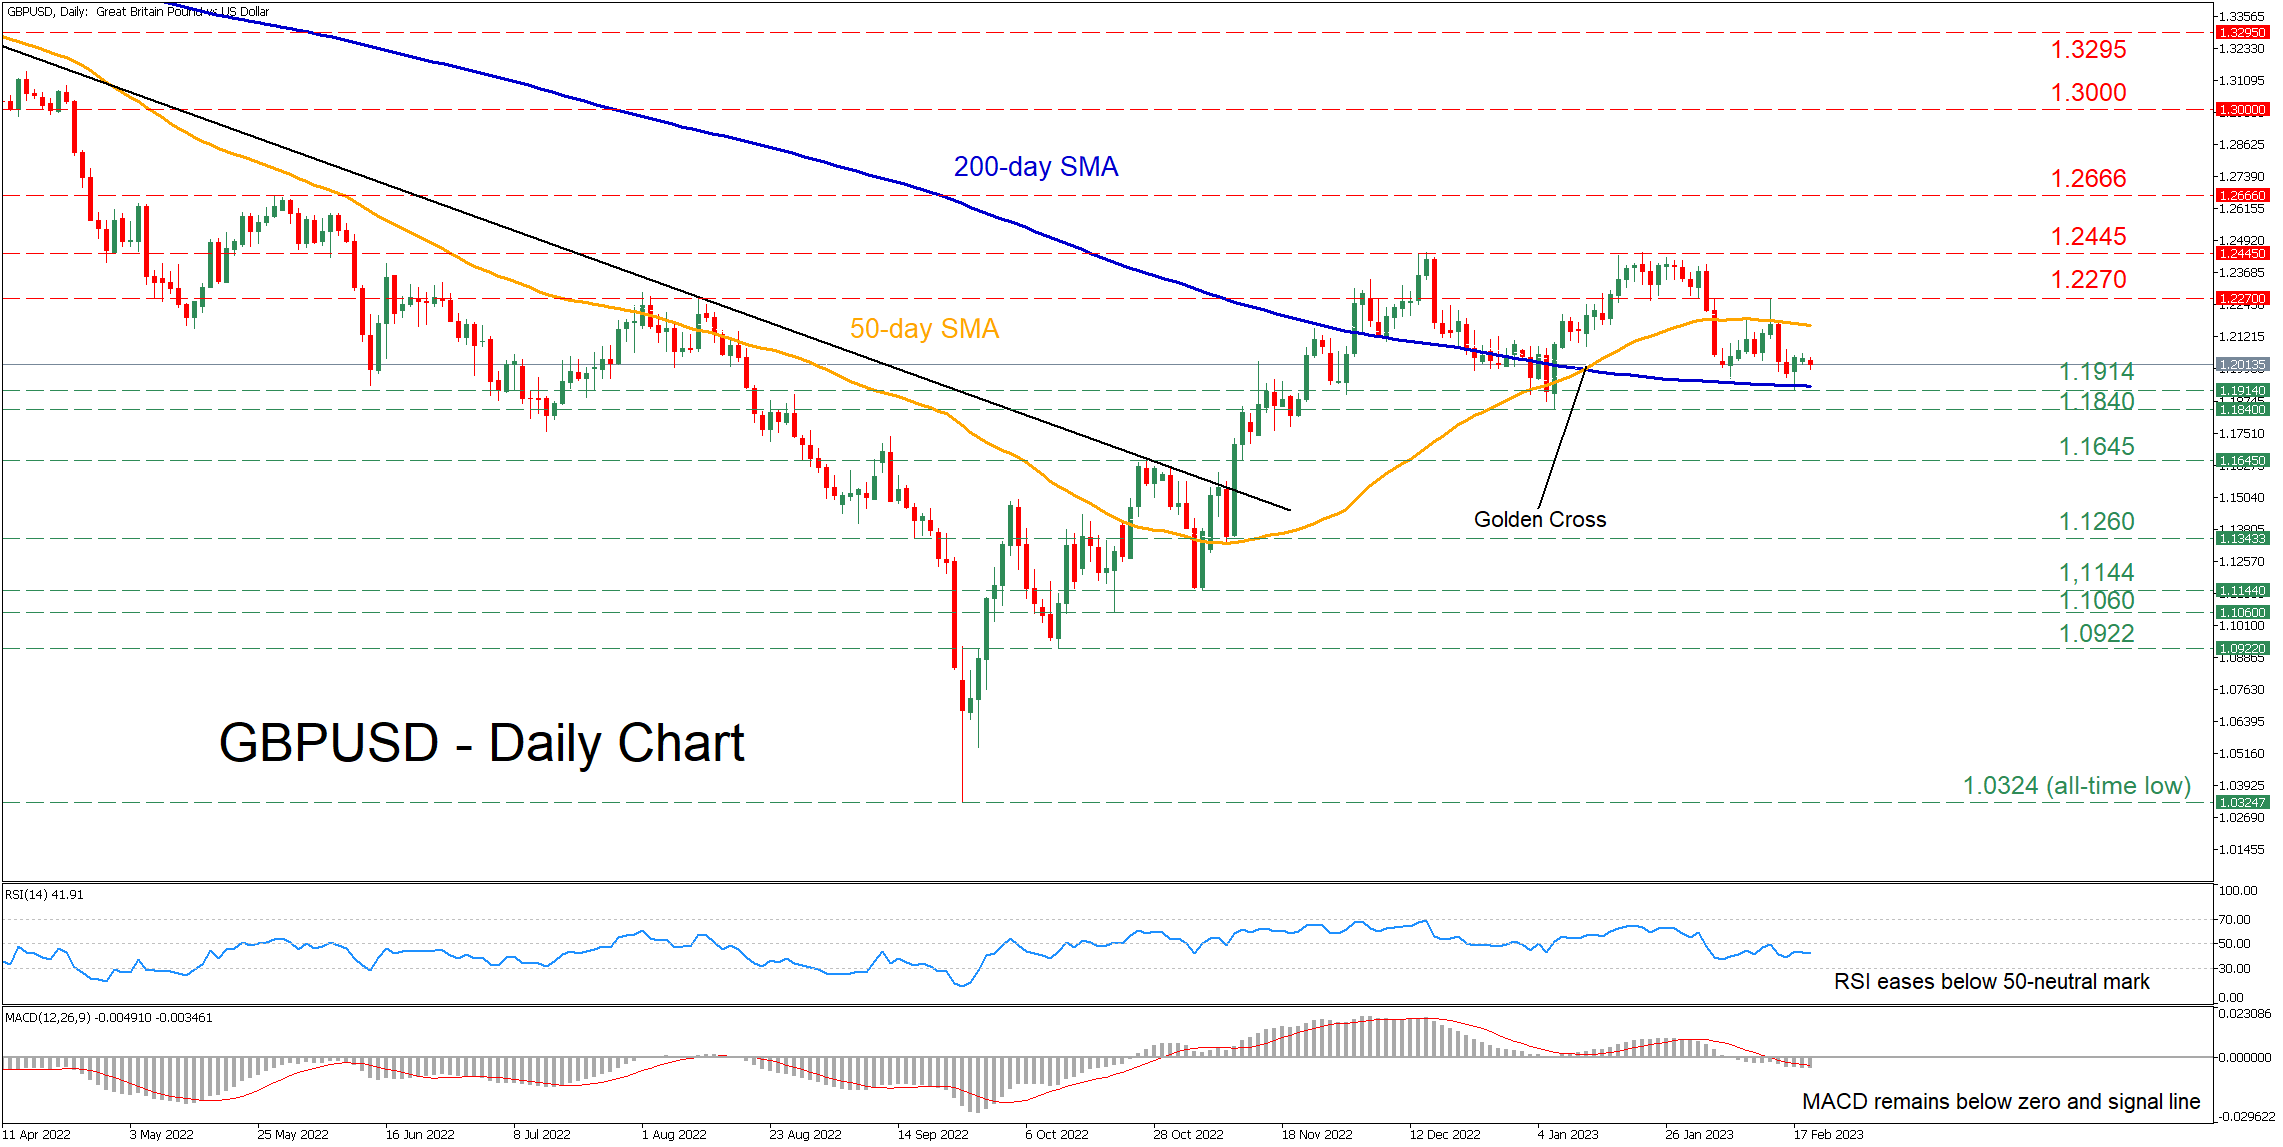
GBPUSD has been attempting a solid recovery since September when the pair fell to an all-time low of 1.0324. However, this latest advance appears to be fading after being rejected twice at the 1.2445 region, while the price has been trading sideways between the 50- and 200-day simple moving averages (SMAs) in the past three weeks.
Despite the latest consolidation, the momentum indicators currently suggest that bearish forces have taken control. Specifically, the RSI is pointing downwards below the 50-neutral mark and the MACD histogram is currently found below both zero and its red signal line.
To the downside, if the pair extends its recent downside correction, the congested region between the 200-day SMA and the recent low of 1.1914 could act as the first line of defence. Should that floor collapse, the January low of 1.1840 might come under examination. Even lower, the pair may face the October resistance of 1.1645, which could act as support in the future.
Alternatively, should buyers re-emerge and push the price above its 50-day SMA, initial resistance may be met at the recent peak of 1.2270. Breaking above that zone, the price could ascend to test the crucial 1.2445 territory, which rejected the pair’s rebound twice. Failing to halt there, further advances could come to a halt at the May high of 1.2666.
In brief, GBPUSD remains stuck in a rangebound pattern as its 50- and 200-day SMAs have repeatedly capped both its upside and downside. Therefore, a break above or below this tight range is likely to be followed by a significant move in the same direction.


