
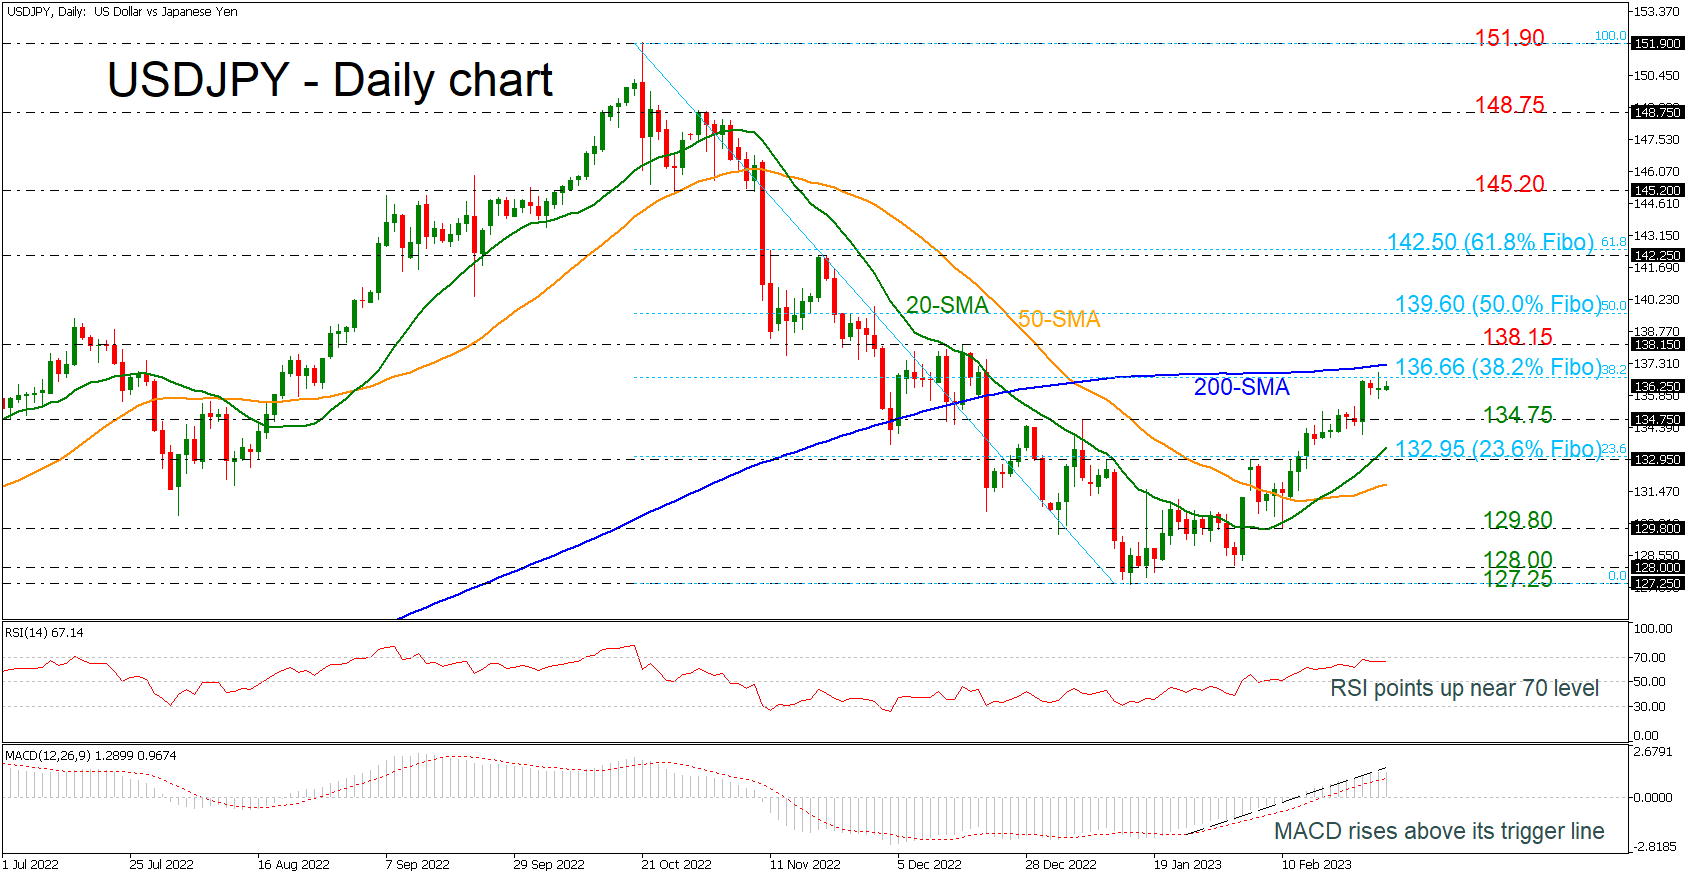
USDJPY is struggling to surpass the 38.2% Fibonacci retracement level of the downward wave from 151.90 to 127.25 at 136.66, where also the 200-day simple moving average (SMA) lies. Any movements above these obstacles could open the door for more positive actions.
Technically, the MACD oscillator is strengthening its momentum above its trigger and zero lines, while the RSI is flattening near the overbought region, suggesting that the market may be overstretched. In trend indicators, the 20- and the 50-day SMAs posted a bullish crossover in the preceding sessions.
If the price overcomes the aforementioned key levels, it may reach the 138.15 resistance and the 50.0% Fibonacci at 139.60. Any moves higher could shift the short-term outlook to a more bullish one, testing the 61.8% Fibonacci at 142.50.
Alternatively, the bears may take the market until the 134.75 immediate support before resting near the 23.6% Fibonacci at 132.95 and the 20-day SMA. Slightly lower, the 50-day SMA at 131.80 may be a turning point for traders. However, more losses could switch the outlook back to bearish, hitting the 129.80 support.
To sum up, USDJPY is looking bullish in the near term and any attempts above the 200-day SMA could endorse this view.


