
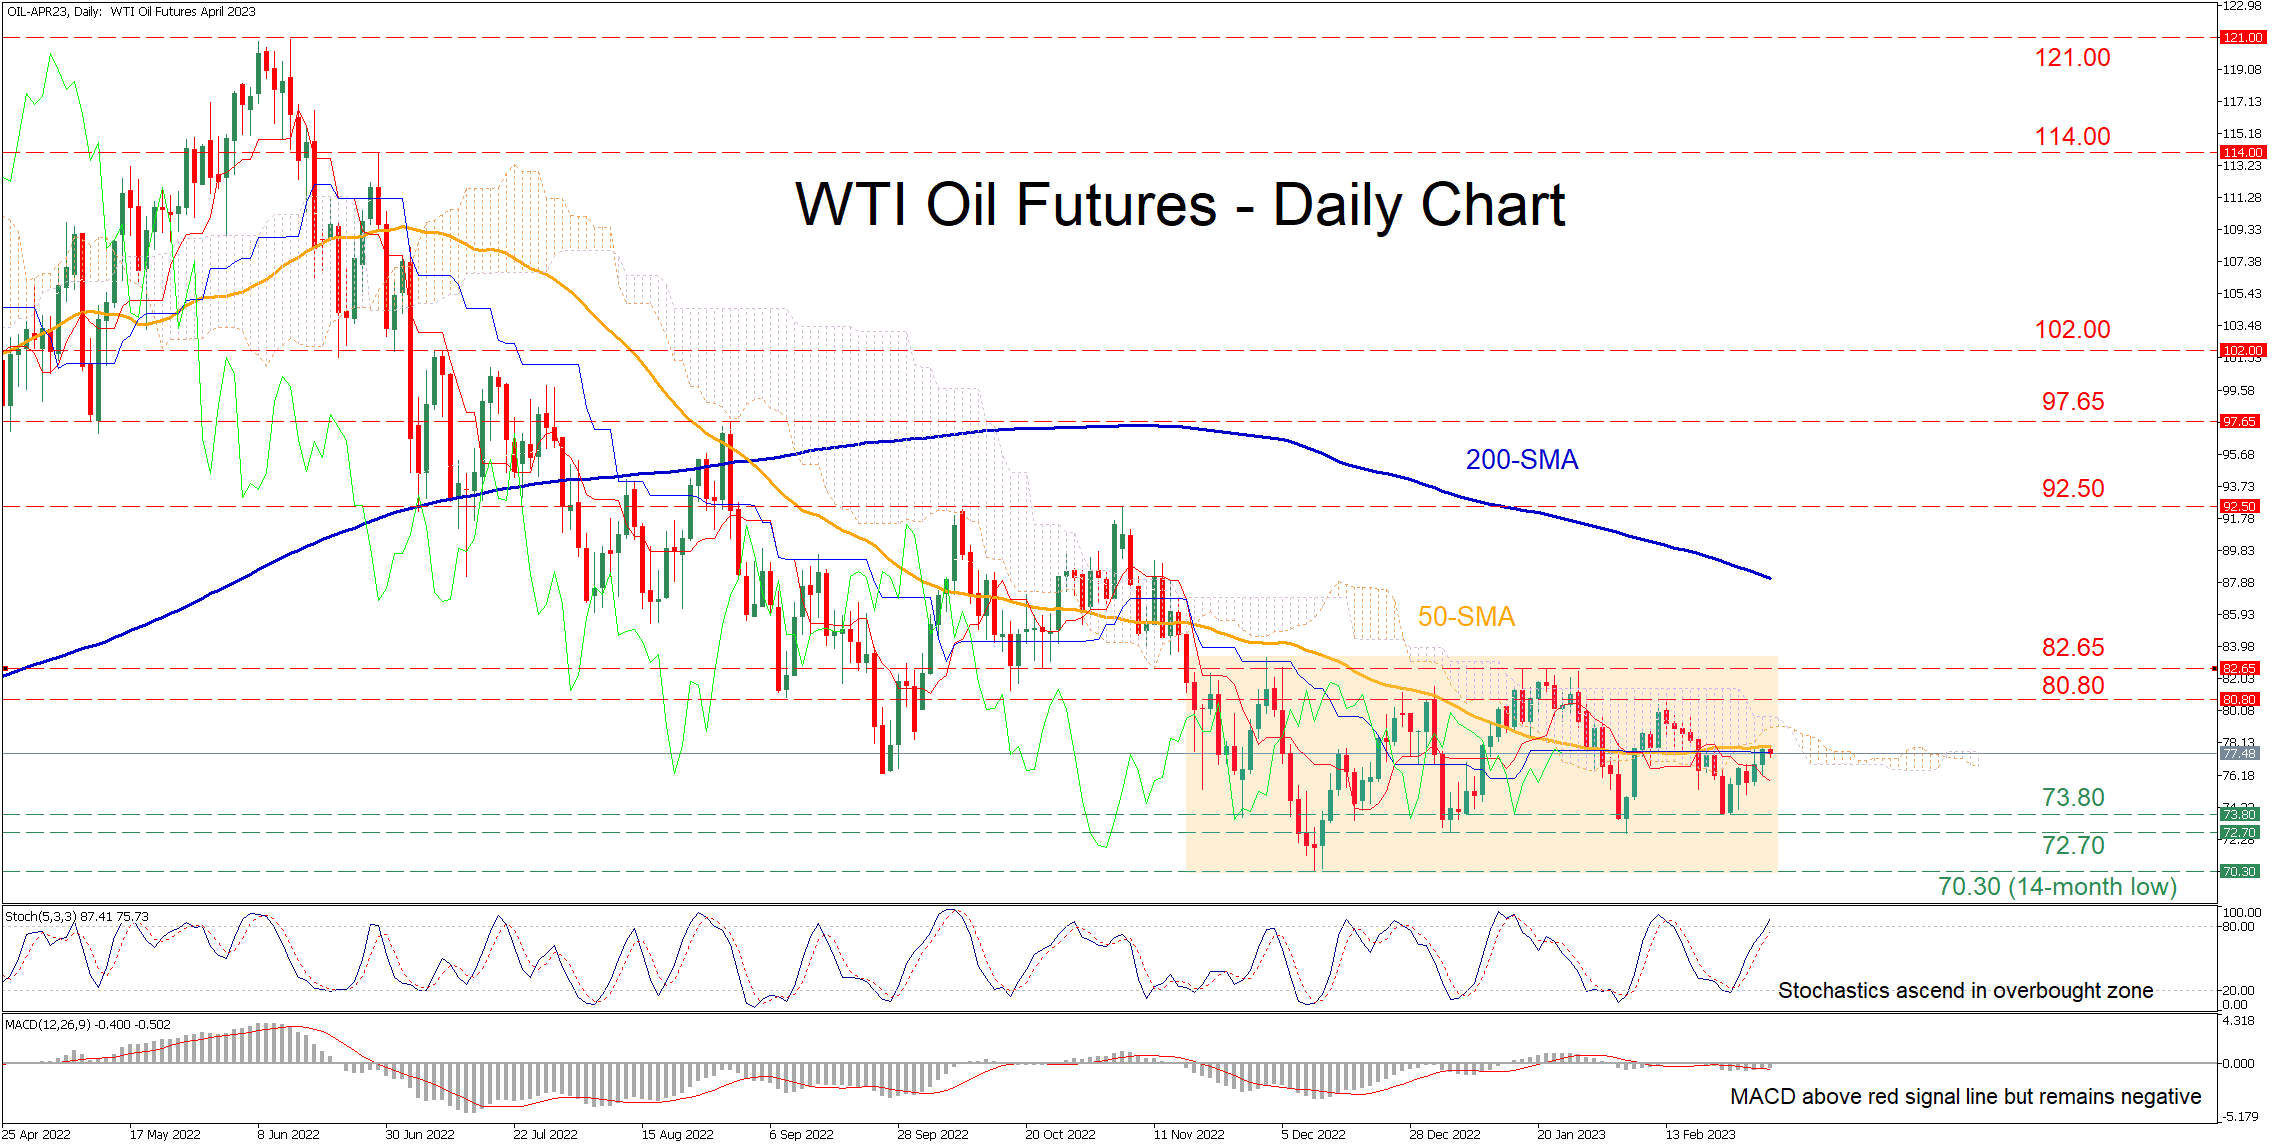
WTI oil futures (April delivery) have been stuck in a rectangle pattern since early November, appearing unable to adopt a clear trend. Meanwhile, the commodity has been gaining ground in the last few daily sessions, but the 50-day simple moving average (SMA) has capped its upside.
The momentum indicators currently suggest that buying pressures are intensifying. Specifically, the stochastic oscillator is ascending near its 80-overbought zone, while the MACD histogram jumped above its red signal line but remains below zero.
To the upside, if the price continues its latest advance, the recent resistance of 80.80 could prove to be the first obstacle for the bulls. Piercing through that zone, the price may challenge the crucial 82.65 territory, which has rejected the commodity’s efforts to break above the wide rectangle three times in January. Even higher, further upside moves could cease at the November high of 92.50.
Alternatively, should sellers re-emerge and push the price lower, initial support could be met at the 73.80 hurdle. Breaking beneath that wall, the February low of 72.70 might curb the commodity’s decline. Failing to halt there, the price could descend to test the 14-month low of 70.30.
In brief, WTI oil futures remain stuck within a rangebound pattern for the last four months, while their latest attempts for a rebound have stalled at the congested region, which includes the 50-day SMA and the lower boundary of the Ichimoku cloud. Hence, an exit from the rectangle is required for the price to gain some directional impetus.


