
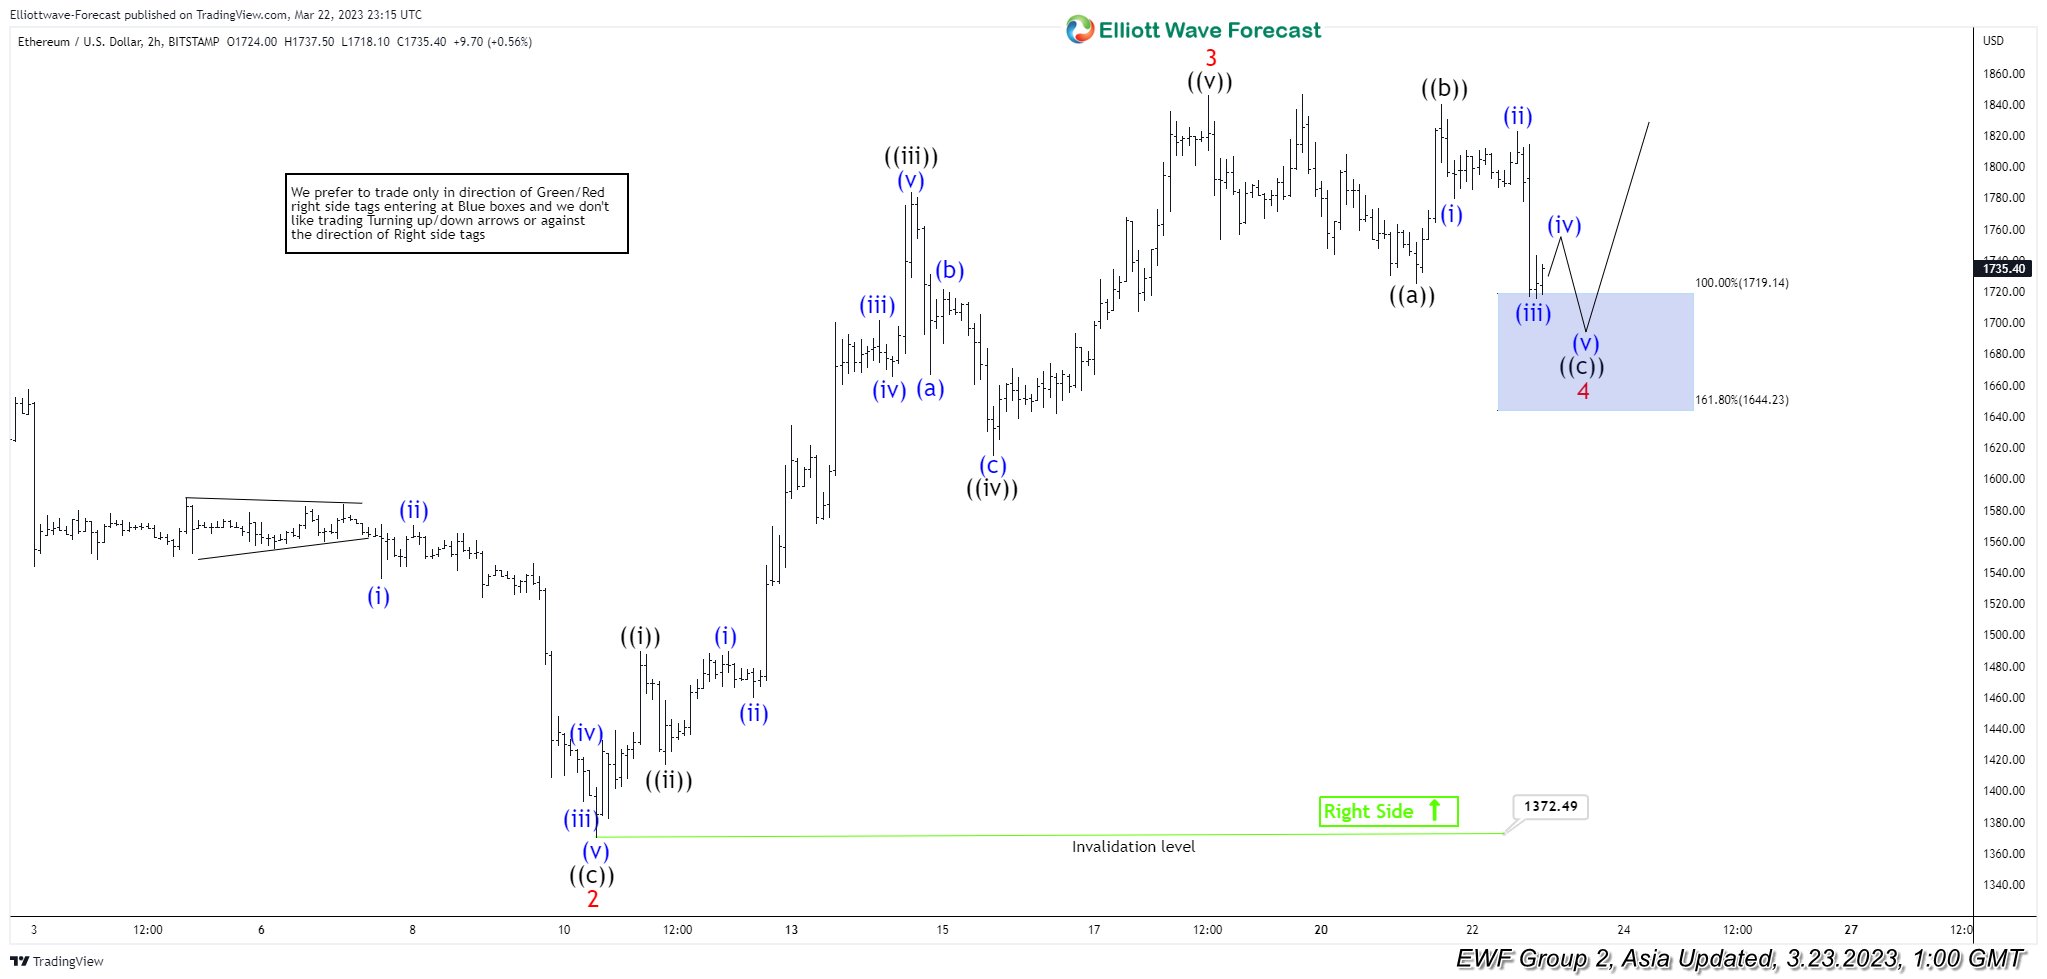
Cycle from November 9, 2022 low in Ethereum (ETHUSD) is in progress as a 5 waves impulse Elliott Wave structure. Up from Nov 9, 2022 low, wave 1 ended at 1742 and wave 2 pullback ended at 1372.49 as the chart below shows. Ethereum has extended higher in wave 3 with internal subdivision as an impulse in lesser degree. Up from wave 2, wave ((i)) ended at 1489.50 and dips in wave ((ii)) ended at 1416.80. The crypto currency extended higher in wave ((iii)) towards 1784.1 and pullback in wave ((iv)) ended at 1614.80. Final leg higher wave ((v)) ended at 1846 which completed wave 3.
Wave 4 pullback is now in progress to correct cycle from March 10, 2023 low before the rally resumes. Internal subdivision of wave 4 is taking the form of a zigzag Elliott Wave structure. Down from wave 3, wave ((a)) ended at 1725 and rally in wave ((b)) ended at 1839.90. Expect wave ((c)) to end soon and Ethereum to extend higher. Potential target for wave ((c)) is 100% – 161.8% Fibonacci extension of wave ((a)). This area comes at 1644.2 – 1719.1 as denoted with the blue box on the chart below. From this area, Ethereum should extend higher or rally in 3 waves at least.
ETHUSD 2 Hour Elliott Wave Chart
Ethereum (ETHUSD) Elliott Wave Video


By loading the video, you agree to YouTube’s privacy policy.
Learn more

: Incomplete Sequences Calling the Decline")


 Could Rally If This Resistance Gives Way")


%20is%20in%20progress%20as%20a%205%20waves%20impulse%20Elliott%20Wave%20structure.%20Up%20from%20Nov%209,%202022%20low,%20wave%201%20ended%20at%201742%20and%20wave%202%20pullback%20ended%20at%201372.49%20as%20the%20chart%20below%20shows.%20Ethereum%20has%20extended%20higher%20in%20wave%203%20with%20internal%20subdivision%20as%20an%20impulse%20in%20lesser%20degree.%20Up%20from%20wave%202,%20wave%20((i))%20ended%20at%201489.50%20and%20dips%20in%20wave%20((ii))%20ended%20at%201416.80.%20The%20crypto%20currency%20extended%20higher%20in%20wave%20((iii))%20towards%201784.1%20and%20pullback%20in%20wave%20((iv))%20ended%20at%201614.80.%20Final%20leg%20higher%20wave%20((v))%20ended%20at%201846%20which%20completed%20wave%203.)