
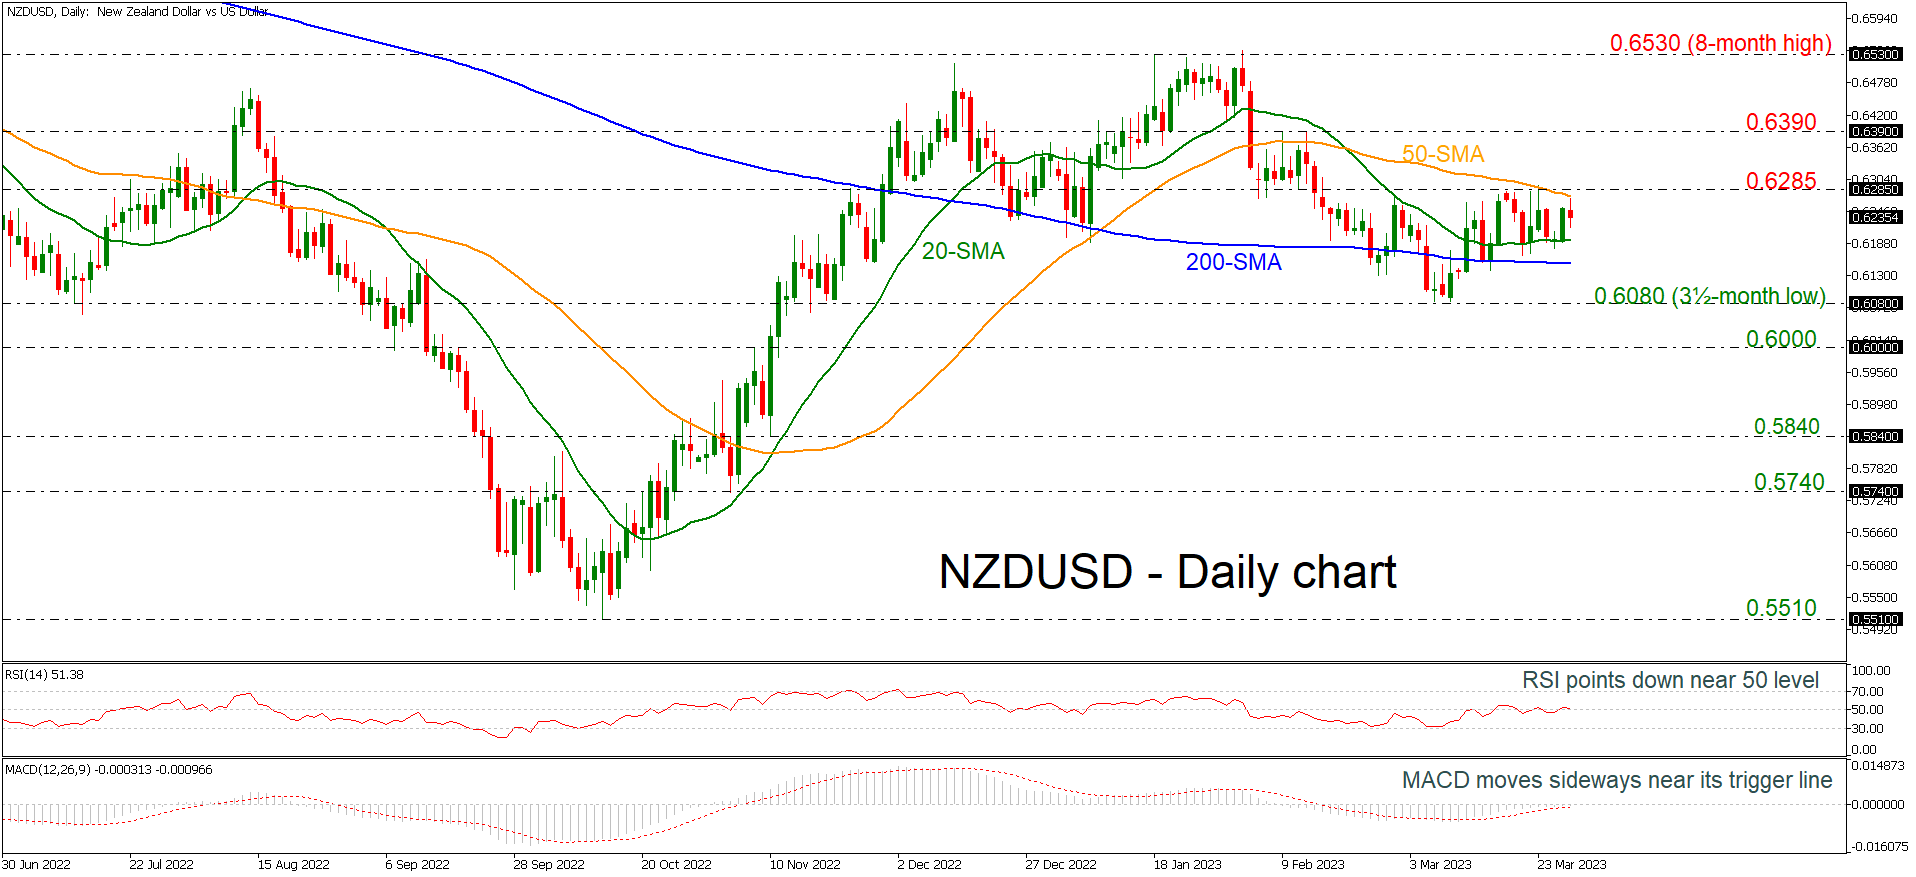
NZDUSD is hovering within a tight range with boundaries of the 20- and the 50-day simple moving averages (SMAs) at 0.6190 and 0.6280 respectively.
From the technical perspective, the RSI is standing near the neutral threshold of 50 and is pointing south, while the MACD is moving sideways below the zero level and near its trigger line.
In the event of an upside reversal, the immediate 0.6285 resistance could act as a significant barrier before being able to re-challenge the 0.6390 obstacle. A break above this level and the eight-month peak of 0.6530 would shift the medium-term outlook to a more positive one.
Further losses should see the 20-day SMA at 0.6190 ahead of the flat 200-day SMA at 0.6150 acting as a major support. A drop lower would meet the three-and-a-half-month low of 0.6080 and the 0.6000 psychological mark, endorsing the short-term bearish structure.
Summarizing, NZDUSD fails to have a clear picture in the very short-term and only a move above or below the SMAs may clear the current view.


%20at%200.6190%20and%200.6280%20respectively.%20%C2%A0)