
DXY (US Dollar) Showing 5 swings impulse Elliott wave sequence lower from the 3/08/2023 high, which ended at $101.415 low on 4/05/2023. Above there, it favors a corrective bounce in 3, 7 or 11 swings before downside resumes. DXY proposed ended (B) at $105.883 high on 3/08/2023. Below there, it placed ((i)) at $103.484 low & ((ii)) at $105.103 high. ((ii)) was 0.618 Fibonacci retracement of first leg. It placed ((iii)) at $101.915 low on 3/23/2023. It bounced off in ((iv)), which ended at $103.357 high on 3/24/2023. Finally, it ended ((v)) as diagonal sequence at $101.415 low on 4/05/2023 to finish wave 1. Above there, it favors a corrective bounce in wave 2, which should fail below (B) high to resume lower as the part of (C) leg, which confirms below February low.
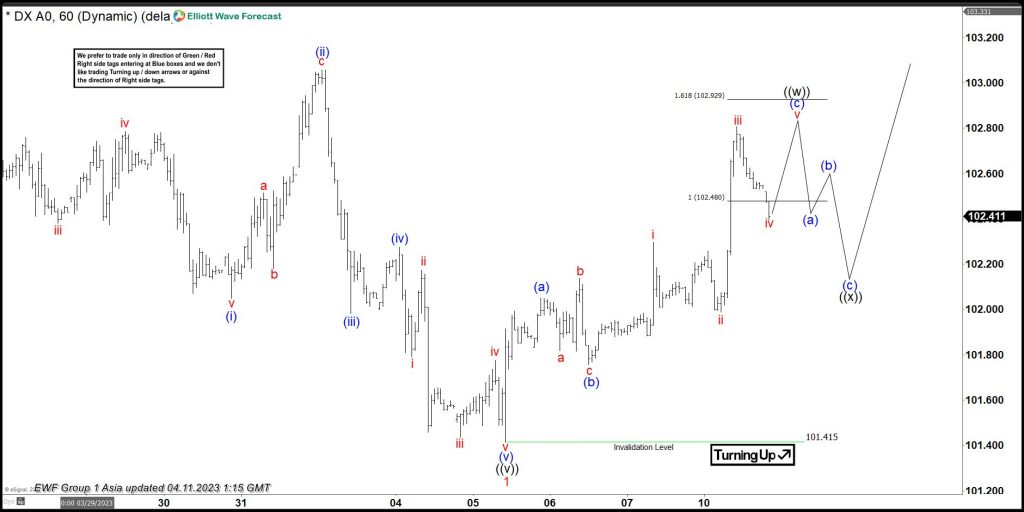
Above wave 1 low, it placed (a) at $102.052 high & (b) at $101.755 low. It favors higher in (c) of ((w)) of wave 2. It placed i at $102.297 high, ii at $101.988 low & iii at $102.807 high. Below there, it favors pullback in iv before final leg higher in v to finish (c) as ((w)) within extreme areas. It may even ended ((w)) leg & correcting lower in ((x)) leg to retest the low before turning higher in wave ((y)) as the part of 2. Wave 2 bounce should fail in 7 or 11 swings from extreme areas in bearish sequence to resumes downside later in wave 3 of (C), which confirms below $101.415 low.
DXY 60 Minute Elliott Wave Chart
DXY Elliott Wave Video


By loading the video, you agree to YouTube’s privacy policy.
Learn more


%20Showing%205%20swings%20impulse%20Elliott%20wave%20sequence%20lower%20from%20the%203/08/2023%20high,%20which%20ended%20at%20$101.415%20low%20on%204/05/2023.%20Above%20there,%20it%20favors%20a%20corrective%20bounce%20in%203,%207%20or%2011%20swings%20before%20downside%20resumes.%20DXY%20proposed%20ended%20(B)%20at%20$105.883%20high%20on%203/08/2023.%20Below%20there,%20it%20placed%20((i))%20at%20$103.484%20low%20&%20((ii))%20at%20$105.103%20high.%20((ii))%20was%200.618%20Fibonacci%20retracement%20of%20first%20leg.%20It%20placed%20((iii))%20at%20$101.915%20low%20on%203/23/2023.%20It%20bounced%20off%20in%20((iv)),%20which%20ended%20at%20$103.357%20high%20on%203/24/2023.%20Finally,%20it%20ended%20((v))%20as%20diagonal%20sequence%20at%20$101.415%20low%20on%204/05/2023%20to%20finish%20wave%201.%20Above%20there,%20it%20favors%20a%20corrective%20bounce%20in%20wave%202,%20which%20should%20fail%20below%20(B)%20high%20to%20resume%20lower%20as%20the%20part%20of%20(C)%20leg,%20which%20confirms%20below%20February%20low.)