
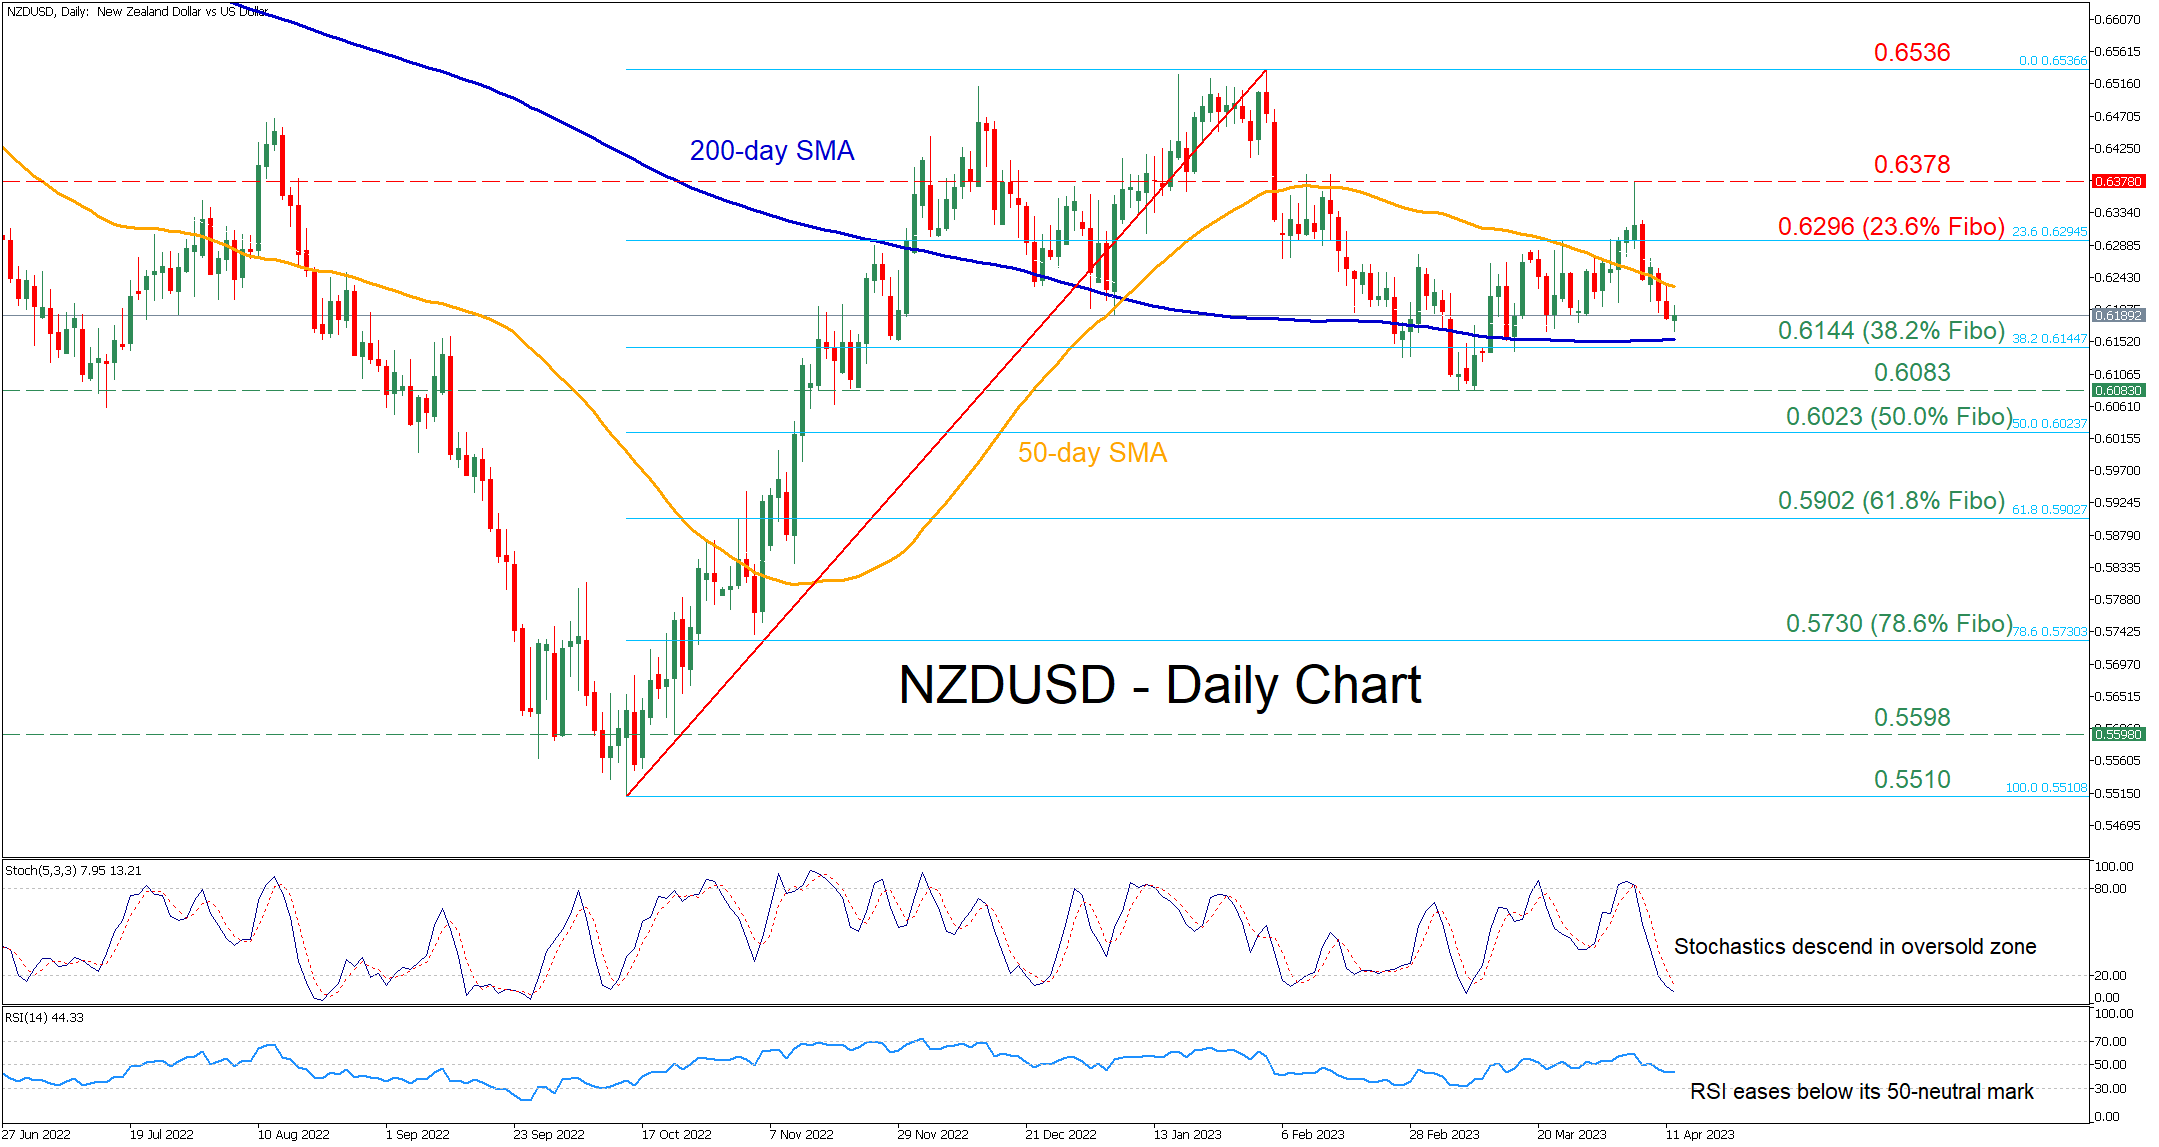
NZDUSD had been steadily gaining ground after finding its feet at the 2023 low of 0.6083 in early March. However, the recovery proved to be short-lived and the price reversed lower, diving beneath its 50-day simple moving average (SMA), while the focus has now shifted towards the 200-day SMA.
The momentum indicators currently suggest that near-term risks are tilted to the downside. Specifically, the stochastic oscillator is declining within the 20-oversold territory, while the RSI has flatlined beneath its 50-neutral mark.
Should bearish pressures intensify and the price cross below its 200-day SMA, 0.6144, which is the 38.2% Fibonacci retracement of the 0.5510-0.6536 upleg, it could act as the first line of defense. If that barricade fails, the spotlight could turn towards the 2023 low of 0.6083. Failing to halt there, the pair could challenge the 50.0% Fibo of 0.6023.
Alternatively, if buyers manage to pause the decline and push the price higher, immediate resistance could be met at the 23.6% Fibo of 0.6296. Piercing through that zone, the pair might ascend towards the recent rejection territory of 0.6378. A break above that region could pave the way for the 2023 peak of 0.6536.
Overall, NZDUSD’s technical picture has deteriorated after its latest rebound encountered strong resistance. Looking forward, the next move could be determined from whether the 200-day SMA manages to hold its ground.


,%20while%20the%20focus%20has%20now%20shifted%20towards%20the%20200-day%20SMA.)