
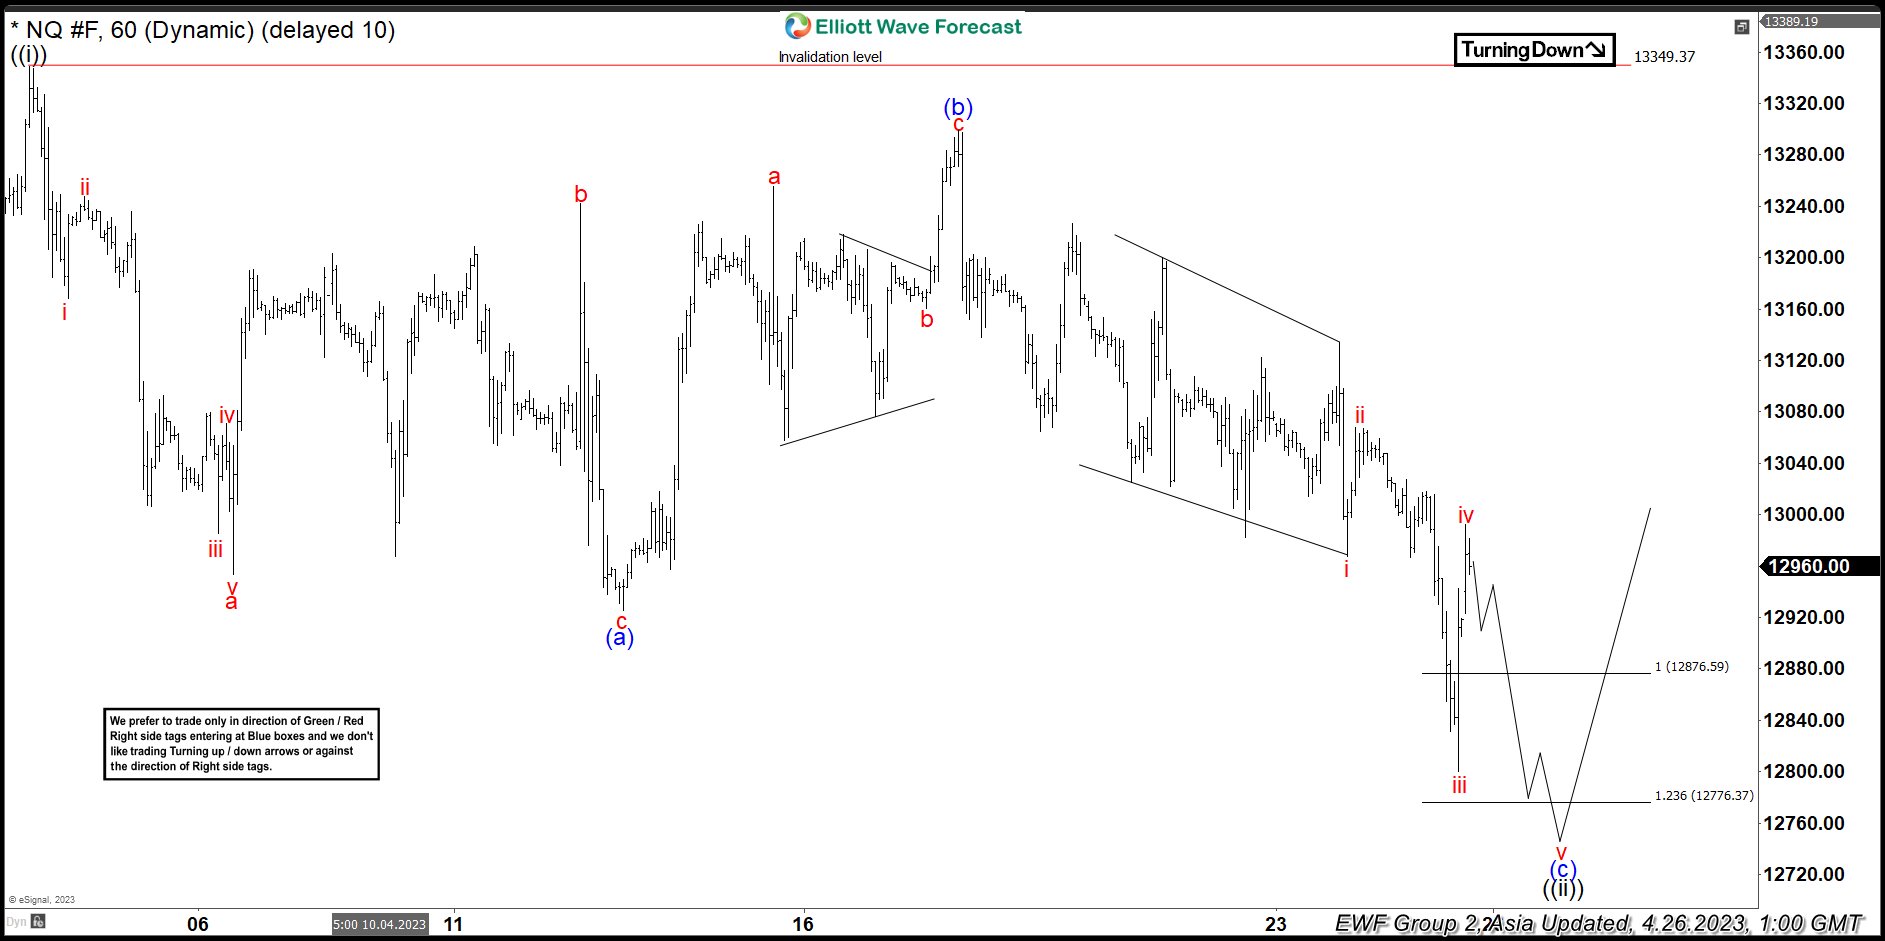
Short Term Elliott Wave in Nasdaq (NQ) suggests the Index is cycle from 3.13.2023 low ended in wave ((1)) at 13349.37 as the 1 hour chart below shows. Wave ((ii)) pullback is currently in progress to correct cycle from 3.13.2023 low. Internal subdivision of wave ((ii)) is unfolding as a double three Elliott Wave structure.
Down from wave ((i)), wave a ended at 12953.25 and wave b ended at 13241.75. Wave c lower ended at 12925.50 which completed wave (a) in higher degree. Wave (b) rally ended at 13298.75 with internal subdivision as a zigzag. Up from wave (a), wave a ended at 13255 and dips in wave b ended at 13160.25. Wave c ended at 13297.75 which completed wave (b). Wave (c) lower is in progress as 5 waves. Down from wave (b), wave i ended at 13065 and rally in wave ii ended at 13226.75. Wave iii ended at 12800. Expect wave iv to end soon and Index to turn lower in wave v to complete wave (c) of ((ii)). Potential target for wave (c) of ((ii)) is 100% – 161.8% Fibonacci extension of wave (a) which comes at 12614.1 – 12876.5.
NQ 60 Minute Elliott Wave Chart
Nasdaq Elliott Wave Video


By loading the video, you agree to YouTube’s privacy policy.
Learn more


%20suggests%20the%20Index%20is%20cycle%20from%203.13.2023%20low%20ended%20in%20wave%20((1))%20at%2013349.37%20as%20the%201%20hour%20chart%20below%20shows.%20Wave%20((ii))%20pullback%20is%20currently%20in%20progress%20to%20correct%20cycle%20from%203.13.2023%20low.%20Internal%20subdivision%20of%20wave%20((ii))%20is%20unfolding%20as%20a%20double%20three%20Elliott%20Wave%20structure.)