
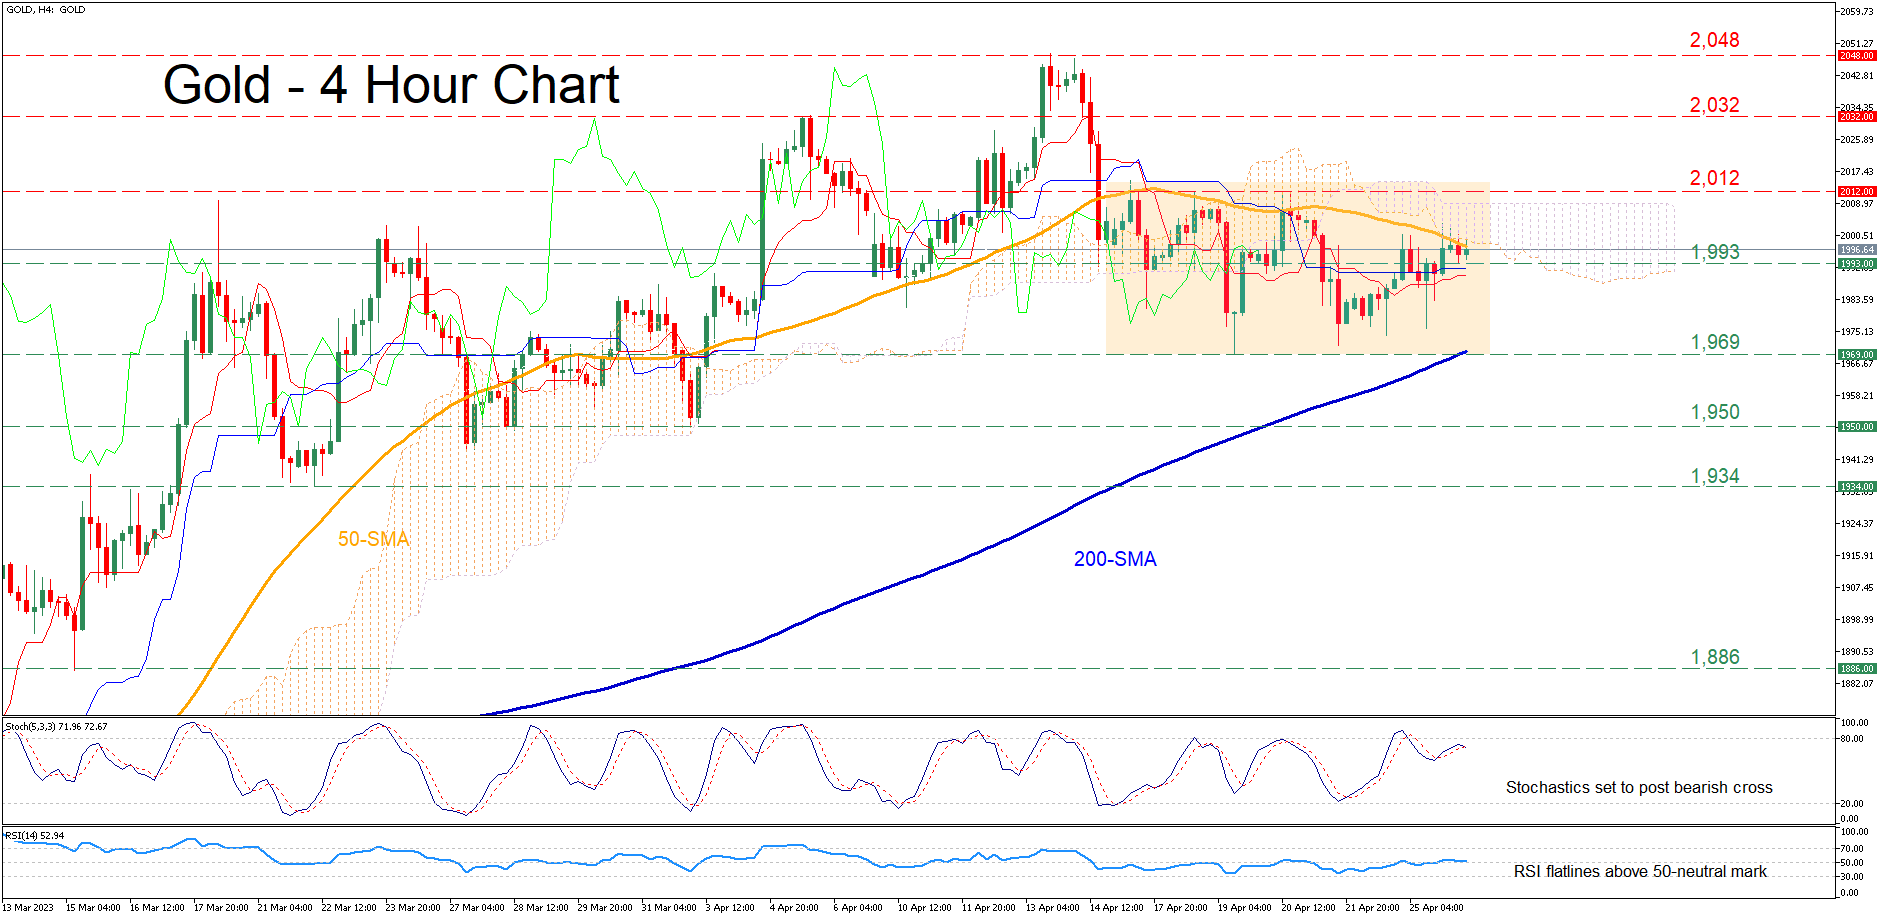
Gold experienced a moderate pullback after peaking at the 13-month high of 2,048 in mid-April. Since then, the price has been trading without a clear direction within a rectangle pattern, while the congested region that includes the 50-period simple moving average (SMA) and the lower bound of the Ichimoku cloud has repeatedly curbed upside efforts.
The momentum indicators currently suggest that the bullish forces are subsiding. Specifically, the stochastic oscillator is set to post a bearish cross, while the RSI is losing ground but remains above its 50-neutral mark.
Should the fortified zone hold, the price could reverse lower to test the 1,993 hurdle. If that barricade fails, the bears may target the April low of 1,969, which is also the lower end of the recent sideways move. Failing to halt there, bullion could descend towards the crucial support zone of 1,950.
On the flipside, if the price manages to jump above its 50-period SMA, 2,012 could prove to be the first obstacle for buyers to clear. Further advances might then stall at the April resistance of 2,032. A jump above that region could set the stage for the 13-month peak of 2,048.
In brief, gold seems to be in a consolidation phase, with its latest advance faltering around a crucial technical region. Therefore, it could be argued that a break above or below the recent range is required for the price to adopt a clear directional impetus.


")


%20and%20the%20lower%20bound%20of%20the%20Ichimoku%20cloud%20has%20repeatedly%20curbed%20upside%20efforts.%C2%A0)