
DXY:
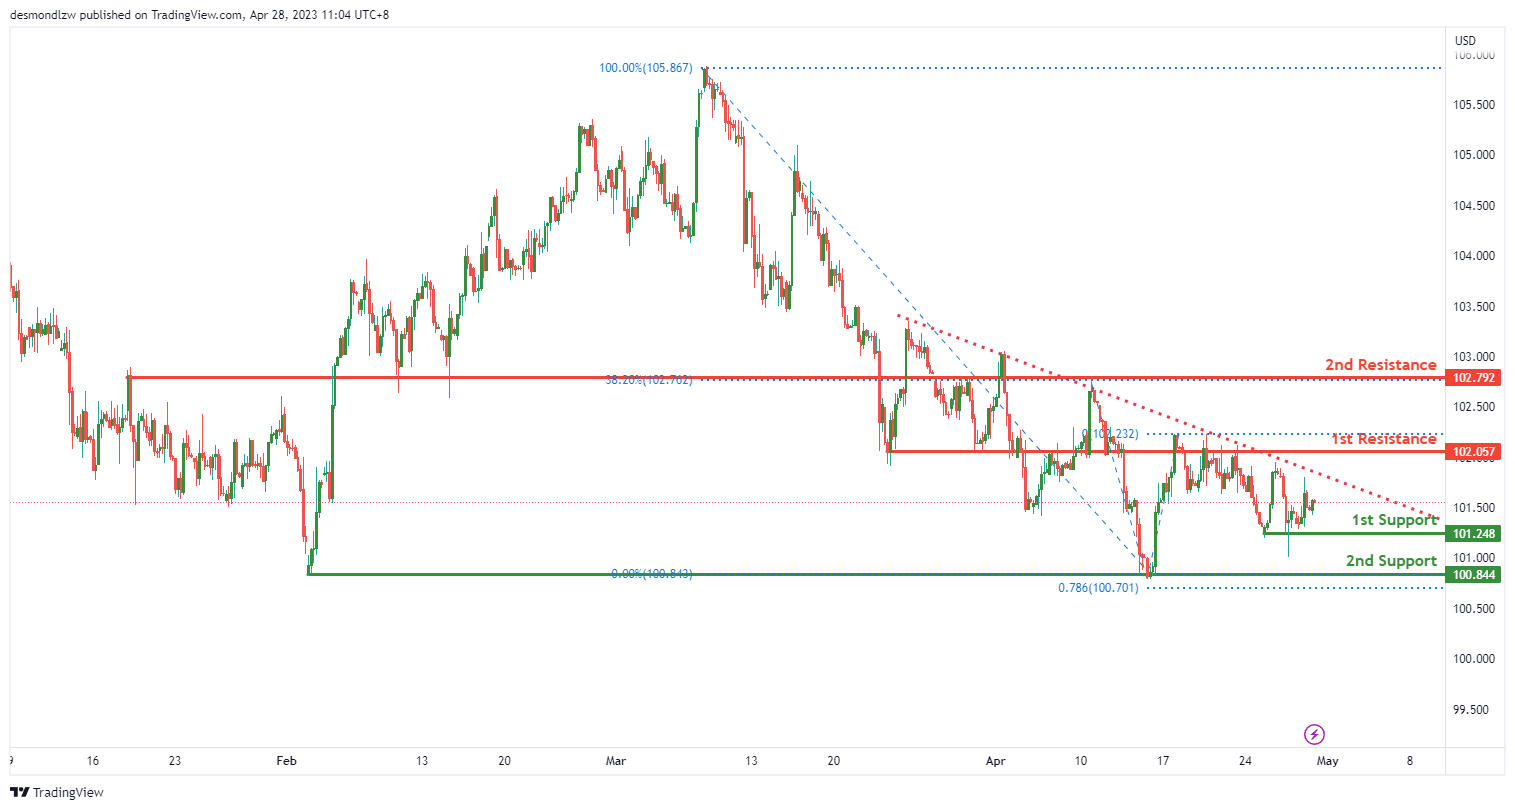
The DXY chart is currently experiencing a bearish momentum. The price is below a major descending trend line, suggesting that bearish momentum is on the cards. Additionally, the price is testing a descending trend line which acts as resistance.
Given the bearish momentum, price could potentially make a bearish continuation towards the 1st support at 101.24. This support level is a multi-swing low support and has previously acted as a strong level of support.
If price were to break the 1st support, the next level of support it could drop to is the 2nd support at 100.84. This support level is also a multi-swing low support and has a 78.60% Fibonacci projection lining up with it, making it an important level to watch.
On the other hand, if the price were to reverse and move upwards, it could encounter the 1st resistance at 102.05. This resistance level is an overlap resistance and could potentially act as a strong level of resistance.
If price were to break the 1st resistance, it could rise further towards the 2nd resistance at 102.79. This resistance level is also an overlap resistance and has a 38.20% Fibonacci retracement lining up with it, making it an important level to watch.
EUR/USD:
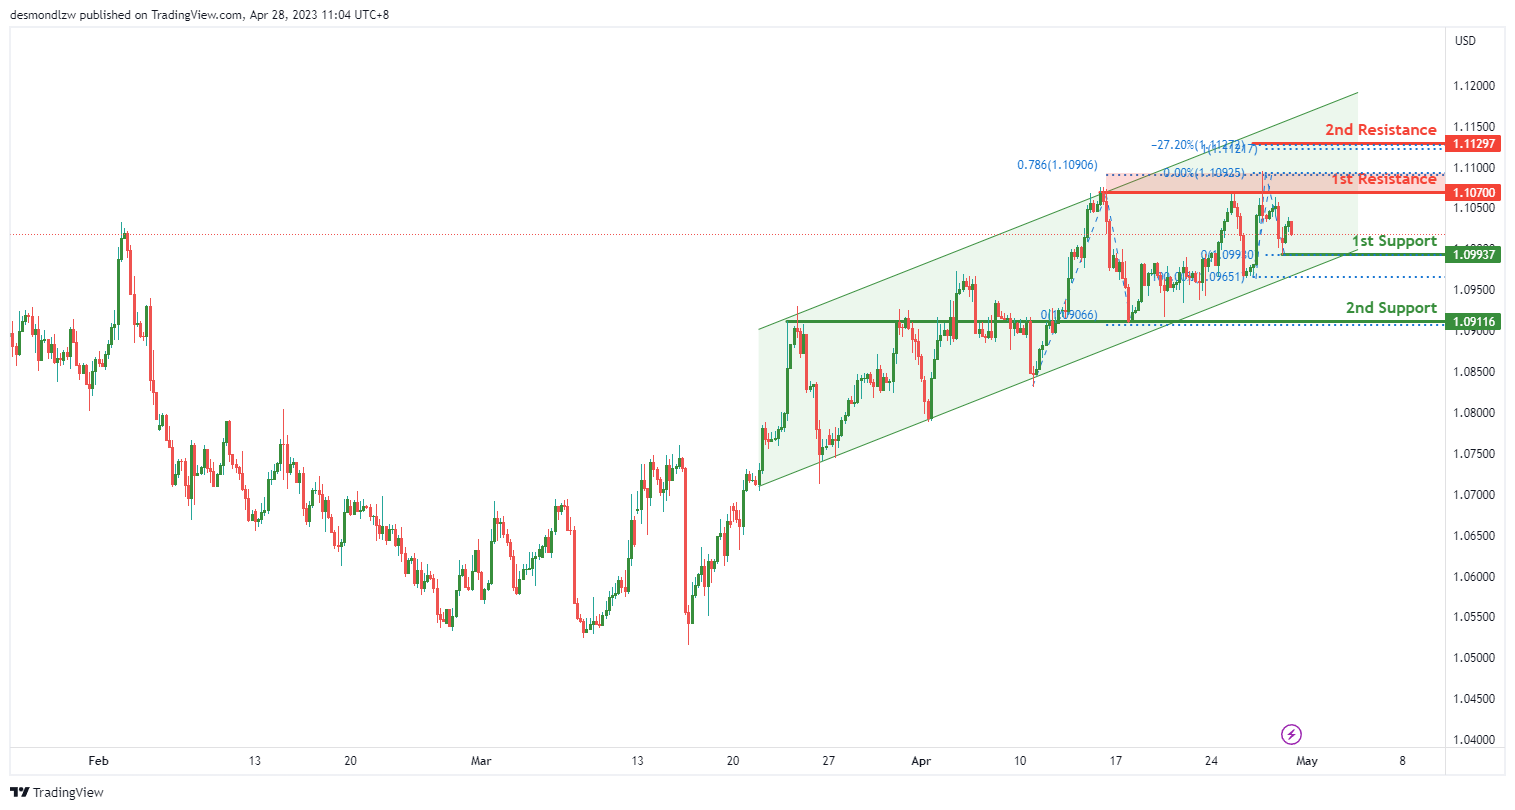
The EUR/USD chart is currently experiencing a bullish momentum. The price is in a bullish ascending channel, which suggests that price might continue to rise because of its bullish momentum.
Given the bullish momentum, price could potentially make a bullish continuation towards the 1st resistance at 1.1070. This resistance level is an overlap resistance and has a 78.60% Fibonacci projection lining up with it, making it an important level to watch.
If the price were to break the 1st resistance, it could rise towards the 2nd resistance at 1.1129. This resistance level has a -27% Fibonacci expansion lining up with it, making it an important level to watch.
On the other hand, if the price were to reverse and move downwards, it could encounter support at the 1st support at 1.0993. This support level is a swing low support and has previously acted as a strong level of support.
If price were to break the 1st support, the next level of support it could drop to is the 2nd support at 1.0911. This support level is also an overlap support, making it an important level to watch.
GBP/USD:
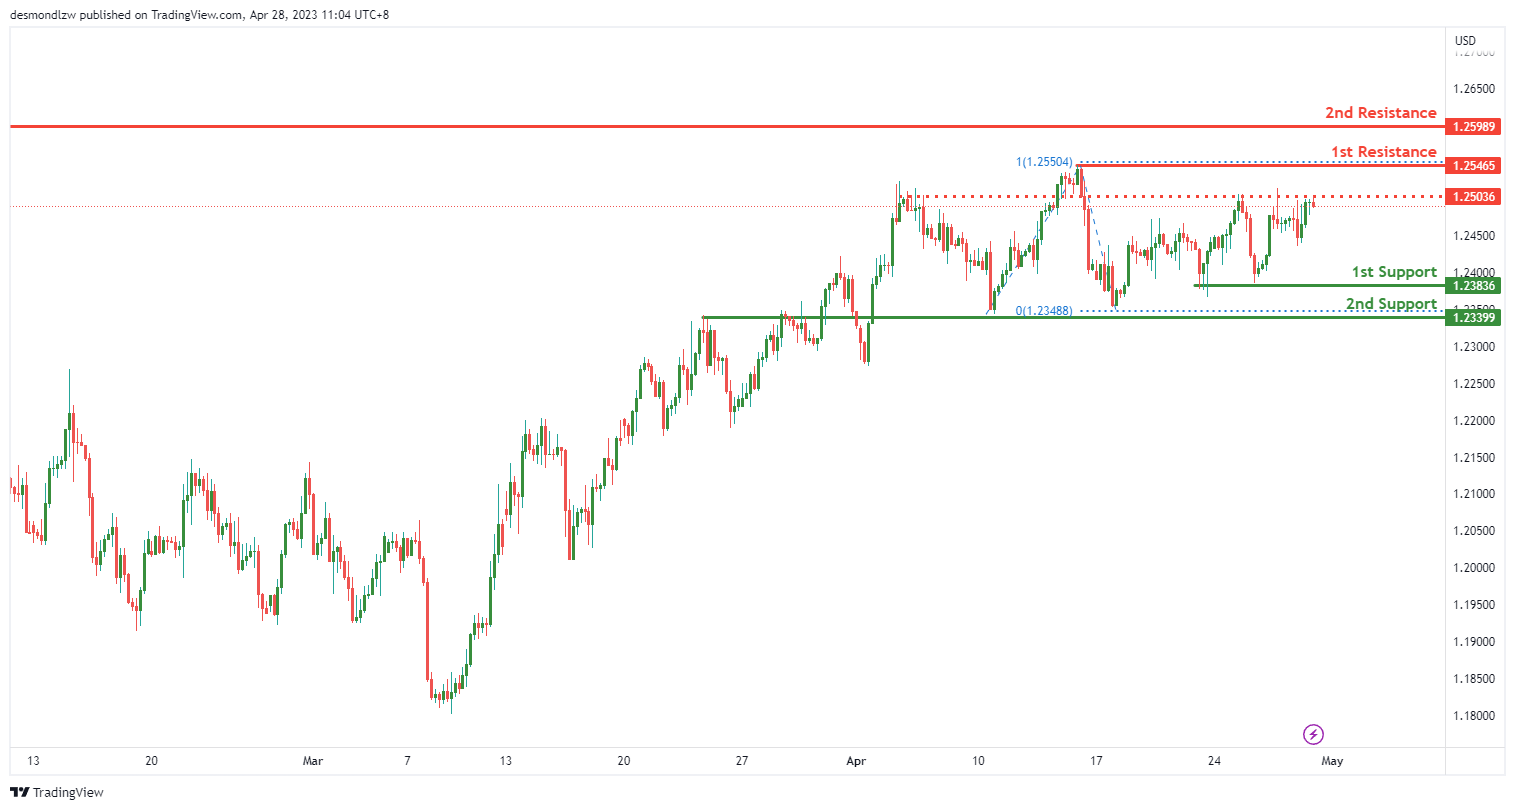
The GBP/USD chart is currently experiencing a bullish momentum. The price is showing signs of strength, and this bullish momentum could potentially lead to a continuation towards the 1st resistance at 1.2546.
If the price were to break the 1st resistance, it could rise further towards the 2nd resistance at 1.2598. This resistance level is a swing high resistance and could potentially act as a strong level of resistance.
On the other hand, if the price were to reverse and move downwards, it could encounter support at the 1st support at 1.2383. This support level is an overlap support and has previously acted as a strong level of support.
If price were to break the 1st support, the next level of support it could drop to is the 2nd support at 1.2339. This support level is also an overlap support, making it an important level to watch.
Additionally, there is an intermediate resistance at 1.2503 between where the price is now and the 1st resistance. If price were to break this intermediate resistance, it could trigger a strong bullish acceleration towards the 1st resistance.
USD/CHF:
The USD/CHF chart is currently experiencing a bearish momentum. The price is below a major descending trend line, suggesting that bearish momentum is on the cards. Additionally, the price is testing a descending trend line which acts as resistance.
Given the bearish momentum, price could potentially make a bearish reaction off the 1st resistance at 0.8960 and drop towards the 1st support at 0.8859. This support level is a multi-swing low support and has previously acted as a strong level of support.
If price were to break the 1st support, the next level of support it could drop to is the 2nd support at 0.8763. This support level is a swing low support and has previously acted as a strong level of support.
On the other hand, if the price were to reverse and move upwards, it could encounter resistance at the 1st resistance at 0.8960. This resistance level is an overlap resistance and could potentially act as a strong level of resistance.
If price were to break the 1st resistance, it could rise towards the 2nd resistance at 0.9006. This resistance level is also an overlap resistance and could potentially act as a strong level of resistance.

USD/JPY:
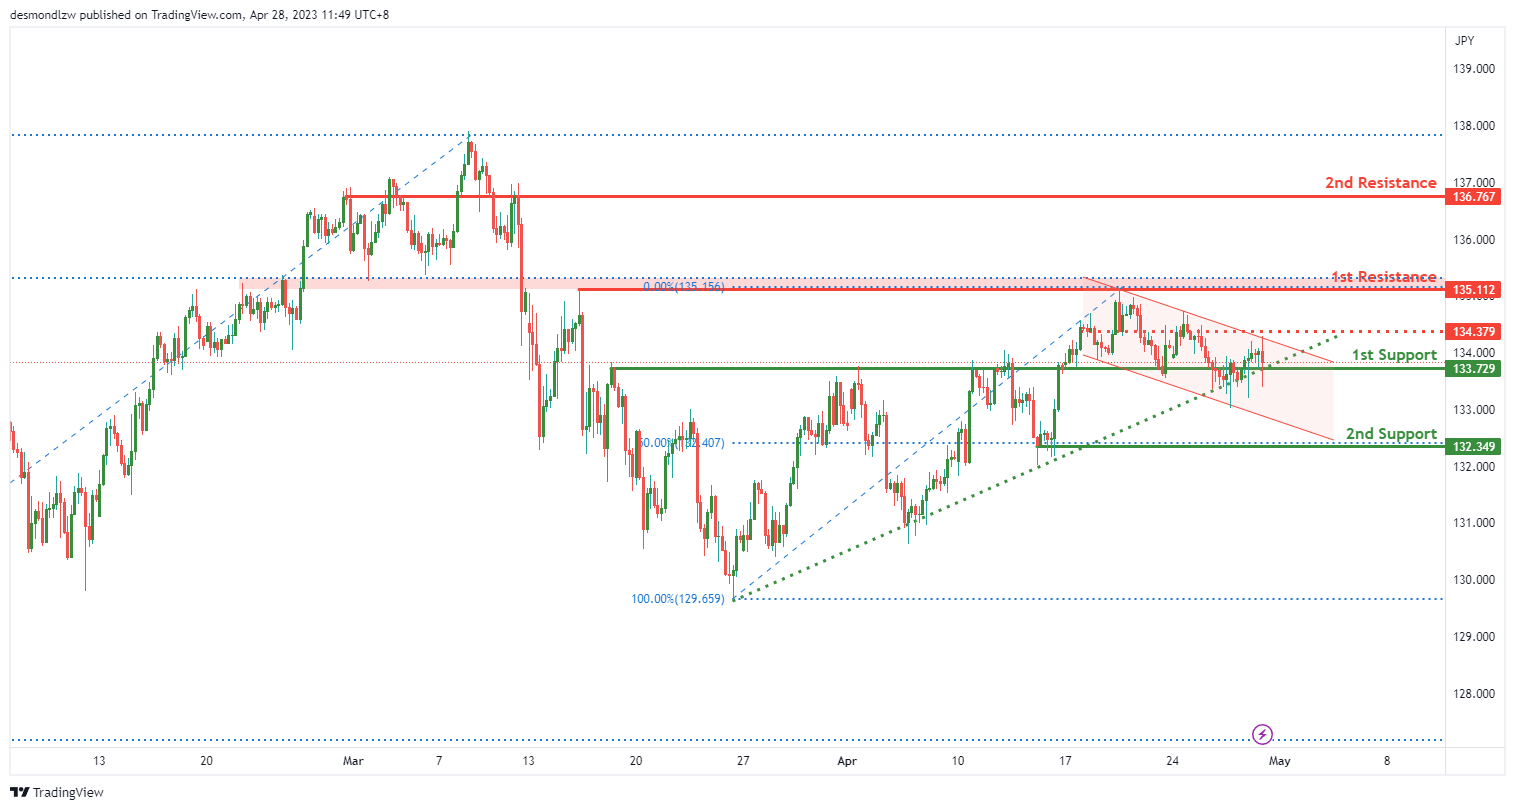
The USD/JPY chart is currently experiencing a bearish momentum. Although the price is above a major ascending trend line, it is also within a bearish descending channel which suggests that price might continue to go lower due to its bearish momentum.
If the price were to break below the ascending trendline, it could potentially drop towards the 1st support at 133.72. Given the bearish momentum, price could potentially make a bearish break off the 1st support and drop towards the 2nd support at 132.34. This support level is a multi-swing low support and has a 50% Fibonacci retracement lining up with it, making it an important level to watch.
If price were to break the 1st resistance at 135.11, it could rise towards the 2nd resistance at 136.76. This resistance level is an overlap resistance and could potentially act as a strong level of resistance.
On the other hand, if the price were to reverse and move downwards, it could encounter resistance at the intermediate resistance at 134.37. This resistance level is an overlap resistance and could potentially act as a strong level of resistance.
If price were to break the intermediate resistance, it could trigger a strong bullish acceleration towards the 1st resistance at 135.11.
AUD/USD:
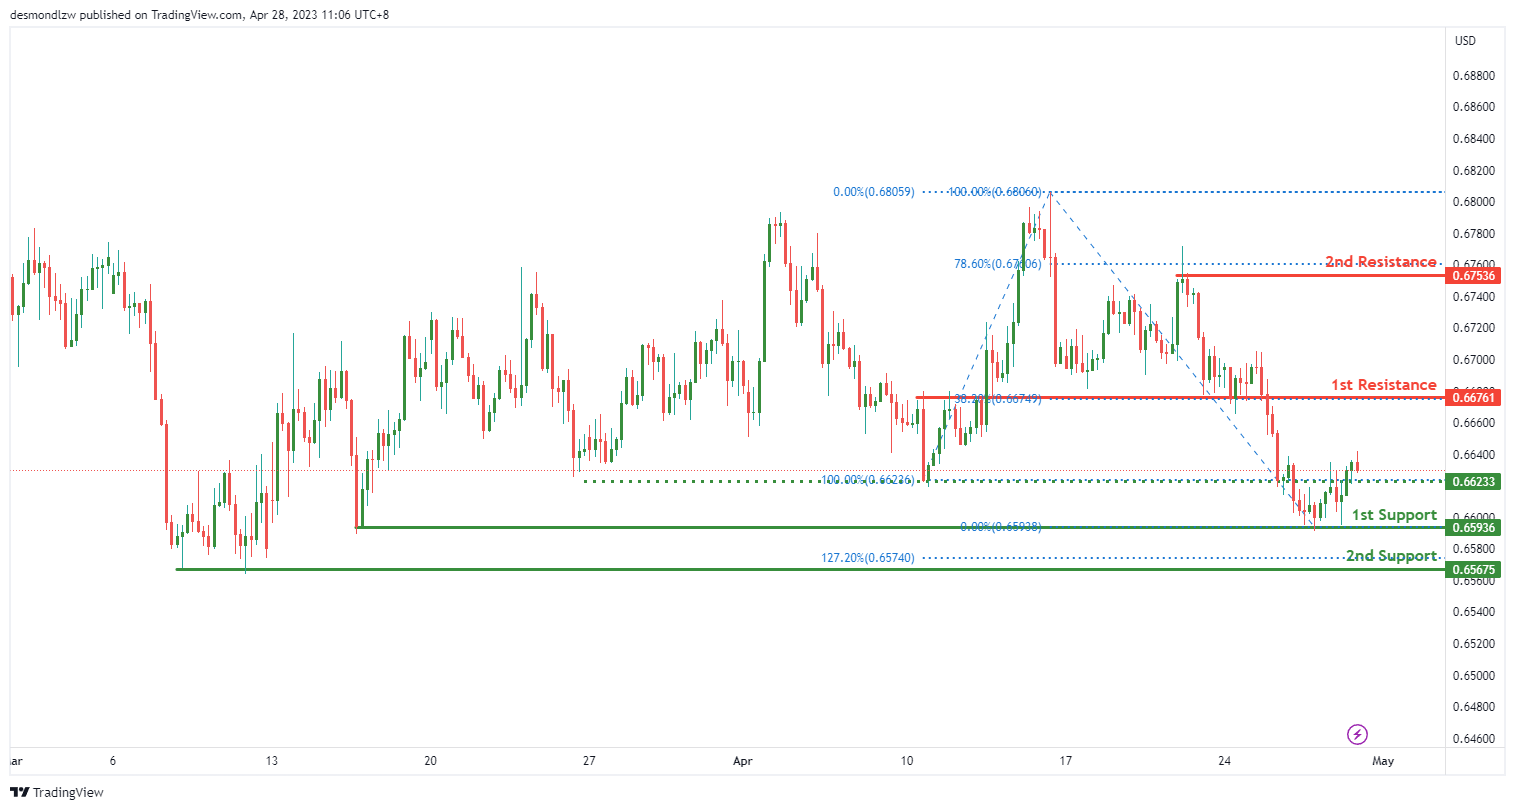
The AUD/USD chart is currently displaying strong bullish momentum, with potential for a bullish continuation towards the 1st resistance level of 0.6676. As of writing, the price is trading at 0.6643, which is above the Ichimoku cloud, indicating a bullish momentum.
There are two strong support levels identified on the chart. The first support level is at 0.6593, which is a multi-swing low support. This level has been tested multiple times in the past and has held up well, making it a good support level for potential price bounces. The second support level is at 0.6567, which is another multi-swing low support and a 127.20% Fibonacci Expansion. If the price were to drop below the first support level, this second support level could provide a good bounce point for prices to reverse back up.
In terms of resistance levels, there are two strong levels to watch out for. The first resistance level is at 0.6676, which is a pullback resistance and coincides with a 38.20% Fibonacci retracement. This resistance level is a good point to look out for potential price reversal. If the price were to break above this resistance level, it could signal a strong bullish momentum, potentially pushing prices up to the second resistance level at 0.6753. This level is a swing high resistance and a 78.60% Fibonacci retracement.
There is also an intermediate support level at 0.6623, which is an overlap support. This level could provide a good bounce point for prices if they were to drop between the current price and the first support level at 0.6593.
NZD/USD:
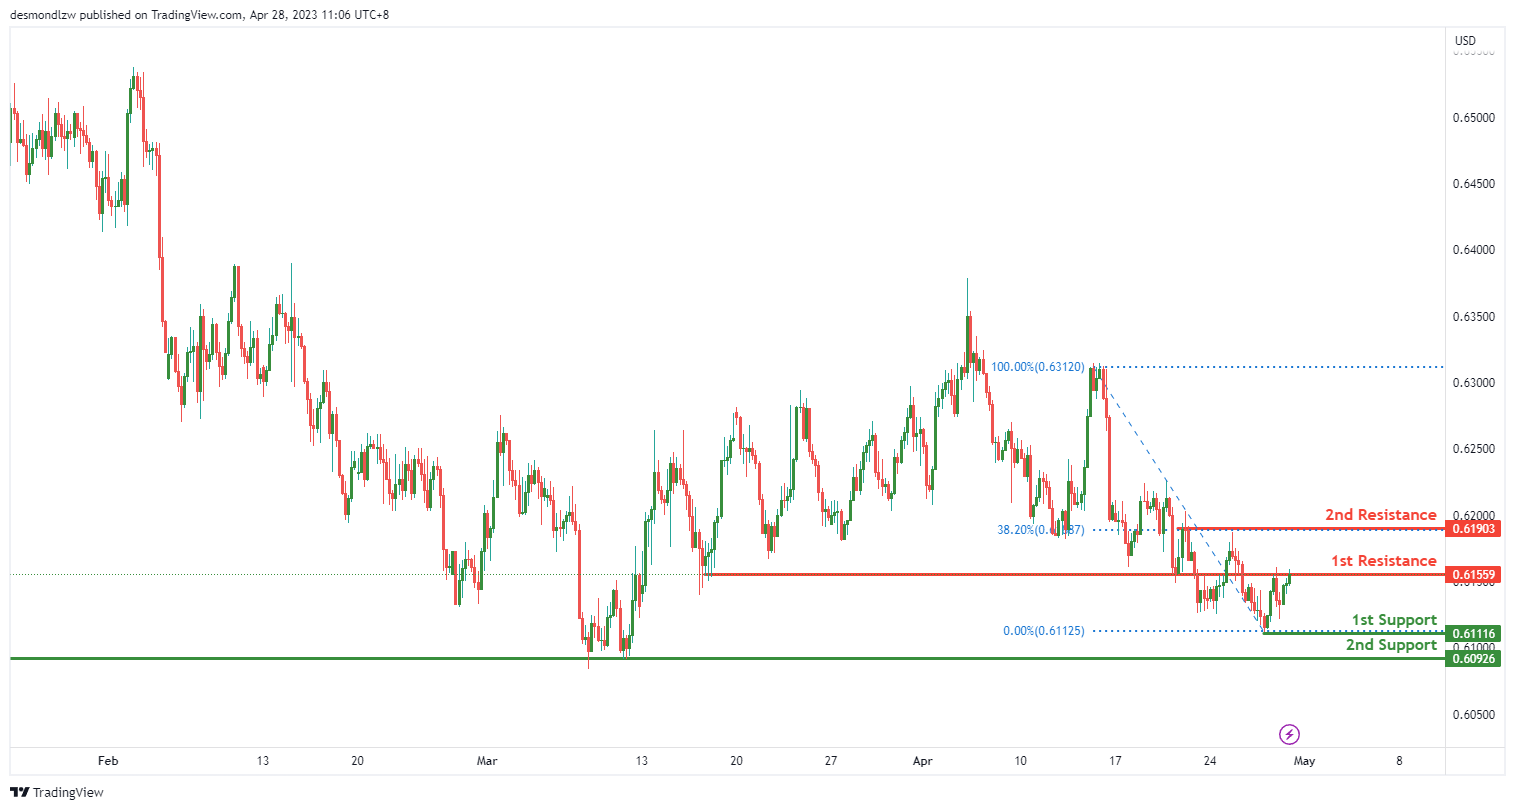
The NZD/USD chart is currently displaying strong bearish momentum, with potential for a bearish reaction off the first resistance level of 0.6155 and a potential drop towards the first support level of 0.6111. As of writing, the price is trading at 0.6133, which is below the Ichimoku cloud, indicating a bearish momentum.
There are two strong support levels identified on the chart. The first support level is at 0.6111, which is a swing low support. This level has been tested multiple times in the past and has held up well, making it a good support level for potential price bounces. The second support level is at 0.6092, which is another multi-swing low support. If the price were to drop below the first support level, this second support level could provide a good bounce point for prices to reverse back up.
In terms of resistance levels, there are two strong levels to watch out for. The first resistance level is at 0.6155, which is an overlap resistance. This resistance level coincides with the 38.20% Fibonacci retracement and could provide a good point to look out for potential price reversals. If the price were to break above this resistance level, it could signal a shift in momentum towards the bullish side, potentially pushing prices up to the second resistance level at 0.6190. This level is a multi-swing high resistance and another 38.20% Fibonacci retracement.
USD/CAD:
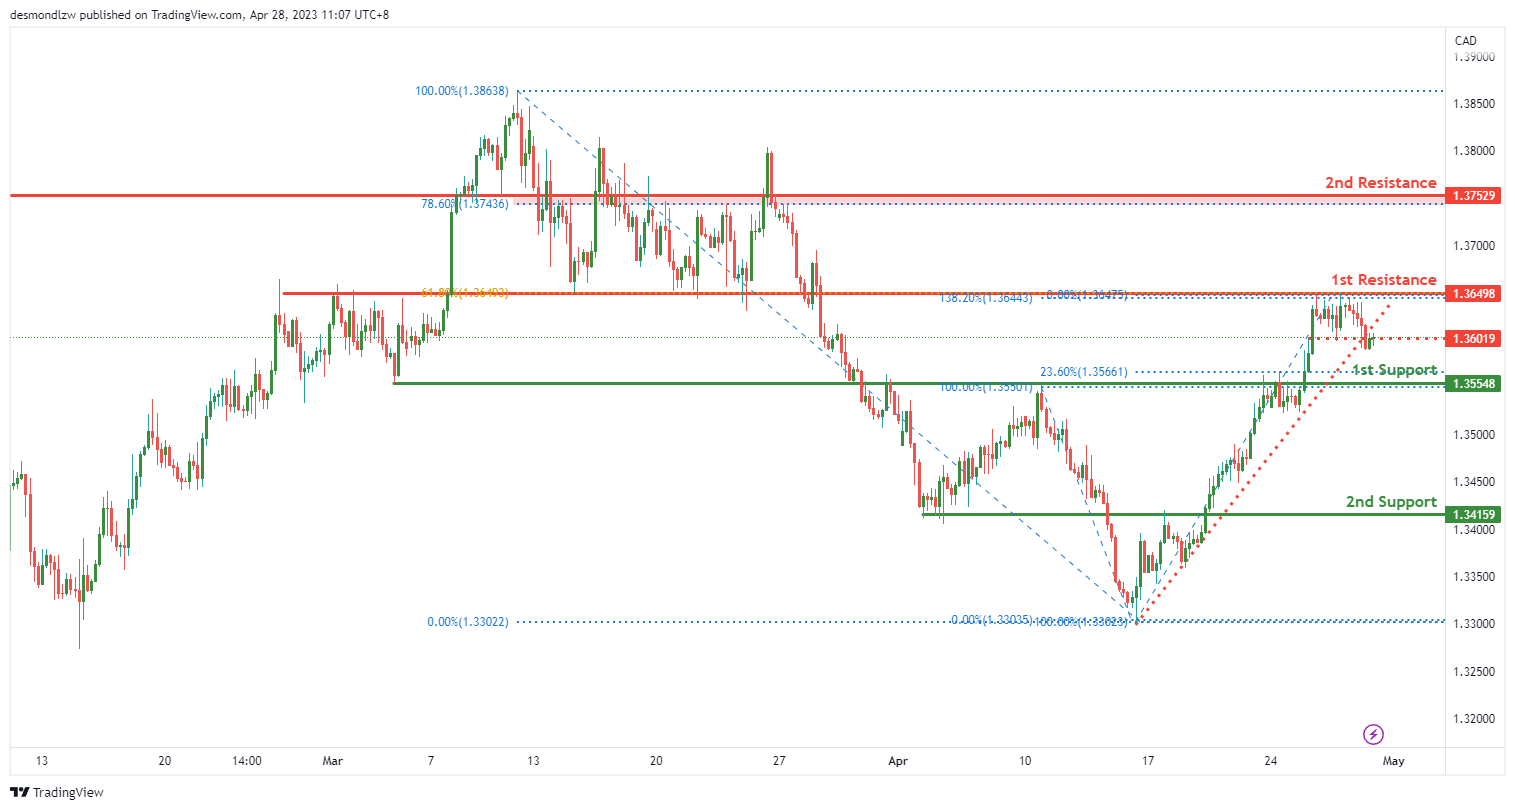
The USD/CAD chart is currently displaying strong bearish momentum, triggered by the break below an ascending support line. As of writing, the price is trading at 1.3567, which is below the Ichimoku cloud, indicating a bearish momentum.
There are two strong support levels identified on the chart. The first support level is at 1.3554, which is a pullback support and coincides with a 38.20% Fibonacci retracement. This support level is a good point to look out for potential price bounces. The second support level is at 1.3415, which is another pullback support. If the price were to drop below the first support level, this second support level could provide a good bounce point for prices to reverse back up.
In terms of resistance levels, there are two strong levels to watch out for. The first resistance level is at 1.3649, which is an overlap resistance and coincides with a 61.80% Fibonacci retracement. This resistance level could provide a good point to look out for potential price reversals. If the price were to break above this resistance level, it could signal a shift in momentum towards the bullish side, potentially pushing prices up to the second resistance level at 1.3752. This level is an overlap resistance and a 78.60% Fibonacci retracement.
There is also an intermediate resistance level at 1.3601, which is a pullback resistance. This level could provide a good point for prices to reverse back down towards the support levels.
DJ30:
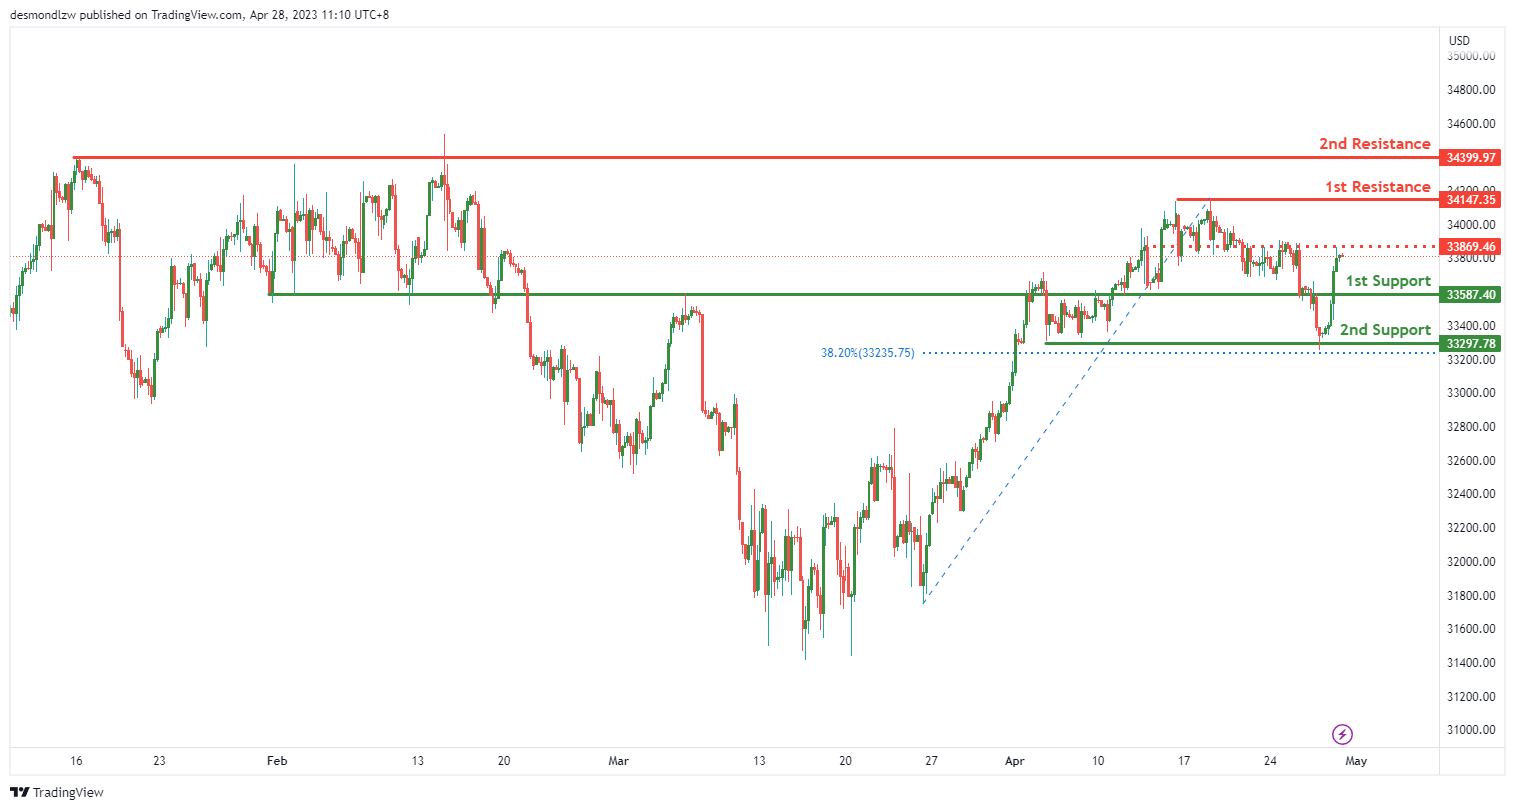
The DJ30 chart is currently displaying strong bullish momentum, with potential for a bullish continuation towards the first resistance level at 34147.35. As of writing, the price is trading at 33938.52, which is above the Ichimoku cloud, indicating a bullish momentum.
There are two strong support levels identified on the chart. The first support level is at 33587.40, which is a pullback support. This support level is a good point to look out for potential price bounces. The second support level is at 33297.78, which is a multi-swing low support and coincides with a 38.20% Fibonacci retracement. If the price were to drop below the first support level, this second support level could provide a good bounce point for prices to reverse back up.
In terms of resistance levels, there are two strong levels to watch out for. The first resistance level is at 34147.35, which is a multi-swing high resistance. This resistance level could provide a good point to look out for potential price reversals. If the price were to break above this resistance level, it could signal a shift in momentum towards the bullish side, potentially pushing prices up to the second resistance level at 34399.97. This level is also a multi-swing high resistance.
There is also an intermediate resistance level at 33869.46, which is a pullback resistance. This level could provide a good point for prices to reverse back down towards the support levels.
GER30:
The GER30 chart is currently displaying strong bullish momentum, with potential for a bullish continuation towards the first resistance level at 15936.79. As of writing, the price is trading at 15709.70, which is above the Ichimoku cloud, indicating a bullish momentum.
There are two strong support levels identified on the chart. The first support level is at 14655.92, which is an overlap support and coincides with a 23.60% Fibonacci retracement. This support level is a good point to look out for potential price bounces. The second support level is at 15483.15, which is another overlap support. If the price were to drop below the first support level, this second support level could provide a good bounce point for prices to reverse back up.
In terms of resistance levels, there are two strong levels to watch out for. The first resistance level is at 15936.79, which is a swing high resistance and coincides with a 78.60% Fibonacci projection. This resistance level could provide a good point to look out for potential price reversals. If the price were to break above this resistance level, it could signal a shift in momentum towards the bullish side, potentially pushing prices up to the second resistance level at 16049.50. This level is a 127.20% Fibonacci expansion.

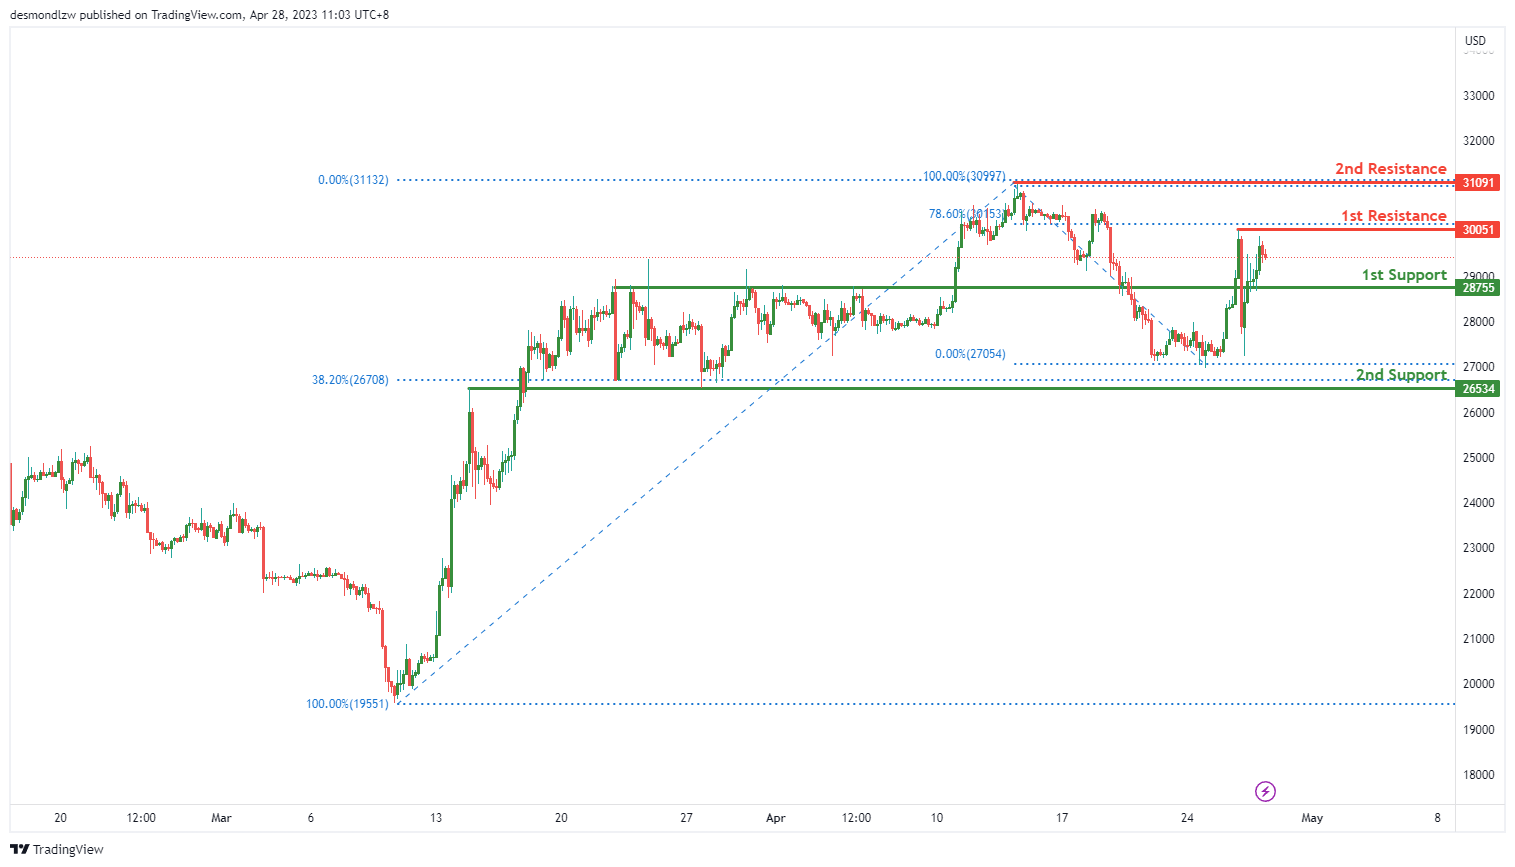
BTC/USD:
The BTC/USD chart is currently displaying bearish momentum, with potential for a bearish reaction off the first resistance level at 30051 and drop to the first support level at 28755. As of writing, the price is trading at 29307.31, which is below the Ichimoku cloud, indicating a bearish momentum.
There are two strong support levels identified on the chart. The first support level is at 28755, which is an overlap support. This support level is a good point to look out for potential price bounces. The second support level is at 26534, which is another overlap support and coincides with a 38.20% Fibonacci retracement. If the price were to drop below the first support level, this second support level could provide a good bounce point for prices to reverse back up.
In terms of resistance levels, there are two strong levels to watch out for. The first resistance level is at 30051, which is a swing high resistance. This resistance level could provide a good point to look out for potential price reversals. If the price were to break above this resistance level, it could signal a shift in momentum towards the bullish side, potentially pushing prices up to the second resistance level at 31091. This level is a swing high resistance and coincides with a 78.60% Fibonacci retracement.
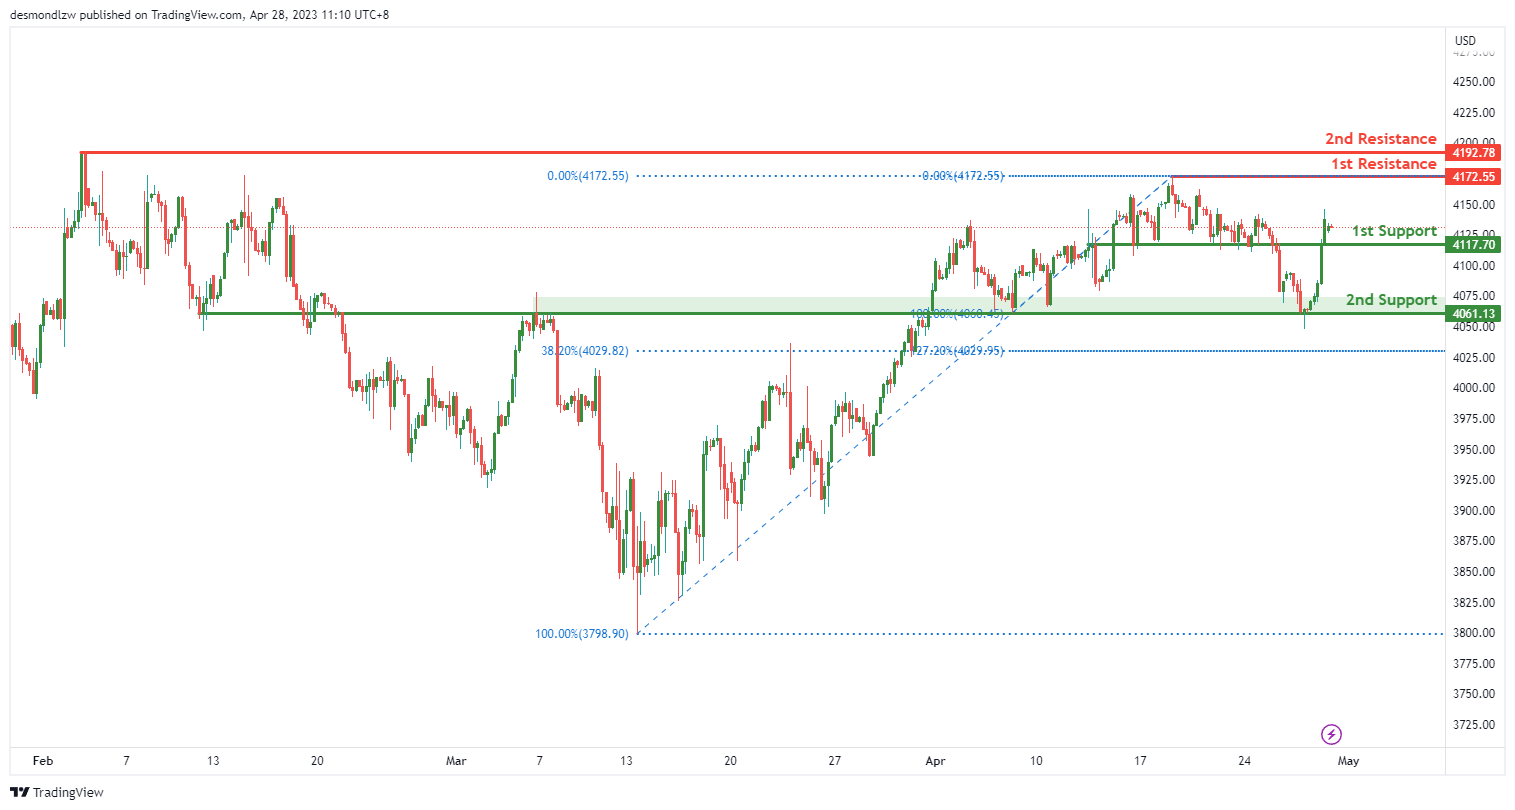
US500
The US500 chart is currently displaying strong bullish momentum, with potential for a bullish continuation towards the first resistance level at 4172.55. As of writing, the price is trading at 4155.70, which is above the Ichimoku cloud, indicating a bullish momentum.
There are two strong support levels identified on the chart. The first support level is at 4147.70, which is a pullback support. This support level is a good point to look out for potential price bounces. The second support level is at 4061.13, which is another pullback support. If the price were to drop below the first support level, this second support level could provide a good bounce point for prices to reverse back up.
In terms of resistance levels, there are two strong levels to watch out for. The first resistance level is at 4172.55, which is a swing high resistance. This resistance level could provide a good point to look out for potential price reversals. If the price were to break above this resistance level, it could signal a shift in momentum towards the bullish side, potentially pushing prices up to the second resistance level at 4192.78. This level is also a swing high resistance.
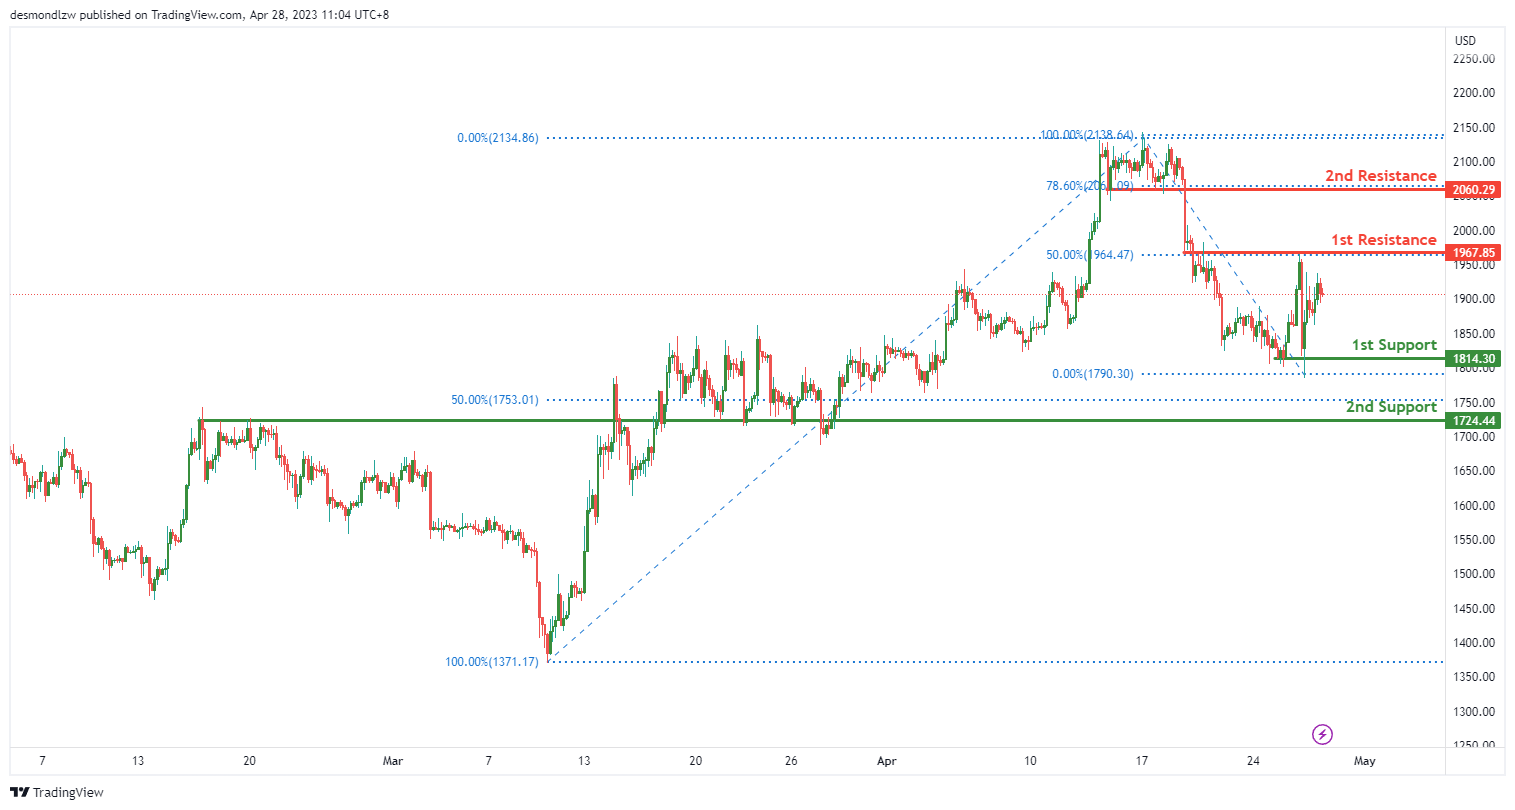
ETH/USD:
The ETH/USD chart is currently displaying bearish momentum, with potential for a bearish continuation towards the first support level at 1814.30. As of writing, the price is trading at 1877.34, which is below the Ichimoku cloud, indicating a bearish momentum.
There are two strong support levels identified on the chart. The first support level is at 1814.30, which is a multi-swing low support. This support level is a good point to look out for potential price bounces. The second support level is at 1724.44, which is an overlap support and coincides with a 50% Fibonacci retracement. If the price were to drop below the first support level, this second support level could provide a good bounce point for prices to reverse back up.
In terms of resistance levels, there are two strong levels to watch out for. The first resistance level is at 1967.85, which is an overlap resistance and coincides with a 50% Fibonacci retracement. This resistance level could provide a good point to look out for potential price reversals. If the price were to break below the first support level, it could signal a shift in momentum towards the bearish side, potentially pushing prices down to the second support level at 1724.44. On the other hand, if the price were to break above the first resistance level, it could potentially rise towards the second resistance level at 2060.29. This level is a pullback resistance and coincides with a 78.60% Fibonacci retracement.
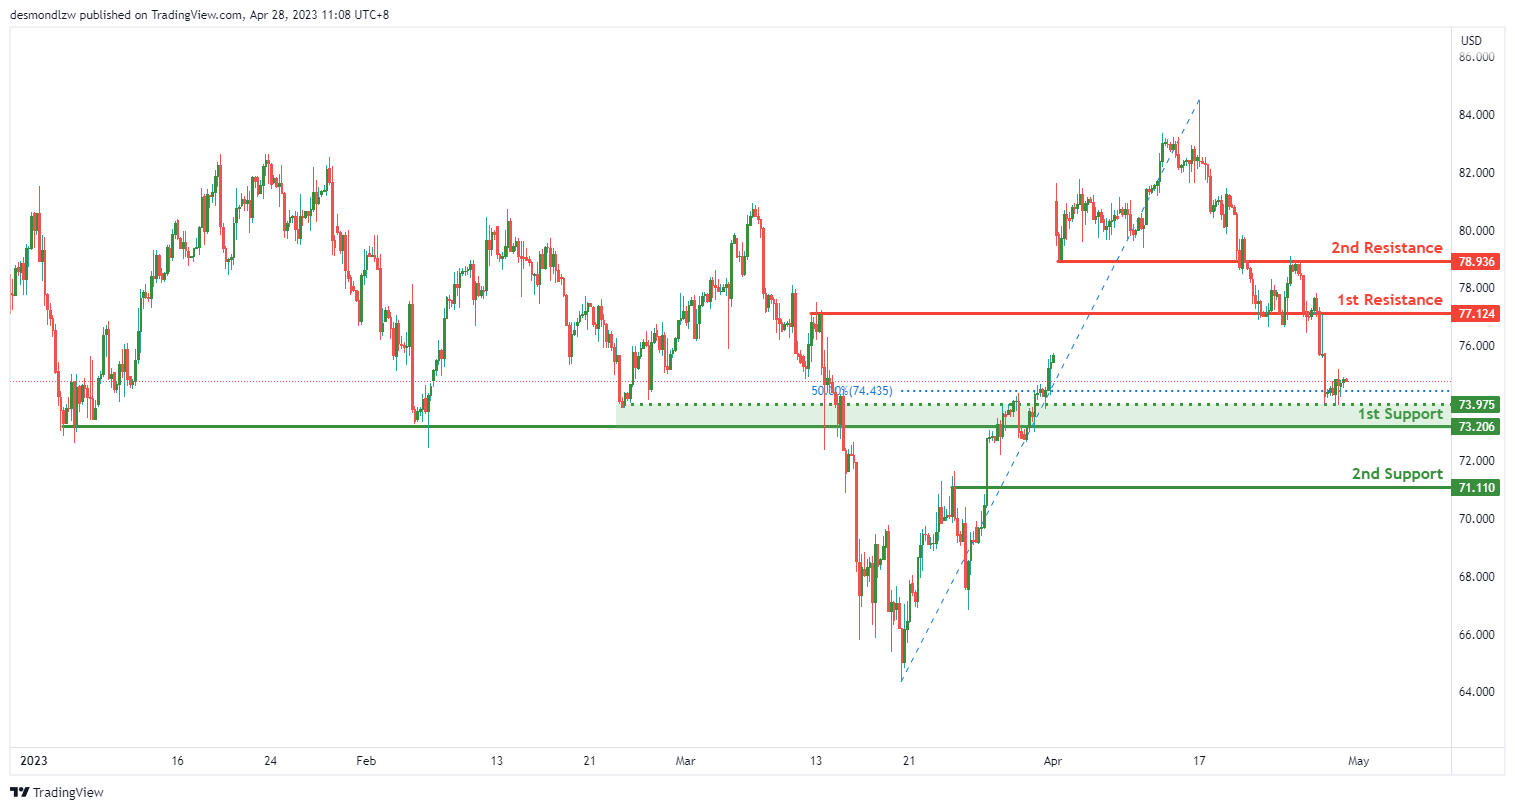
WTI/USD:
The WTI chart is currently displaying bullish momentum, with potential for a bullish bounce off the first support level at 73.20 and heading towards the first resistance level at 77.12. As of writing, the price is trading at 75.75, which is above the Ichimoku cloud, indicating a bullish momentum.
There are two strong support levels identified on the chart. The first support level is at 73.20, which is a pullback support. This support level is a good point to look out for potential price bounces. The second support level is at 71.11, which is also a pullback support. If the price were to drop below the first support level, this second support level could provide a good bounce point for prices to reverse back up.
In terms of resistance levels, there are two strong levels to watch out for. The first resistance level is at 77.12, which is an overlap resistance. This resistance level could provide a good point to look out for potential price reversals. If the price were to break above the first resistance level, it could potentially rise towards the second resistance level at 78.93. This level is also an overlap resistance, and both resistance levels indicate potential for further bullish momentum.
There is also an intermediate support level at 73.97, which is an overlap support. This level could potentially provide a good point to watch out for a bullish continuation towards the first resistance level.
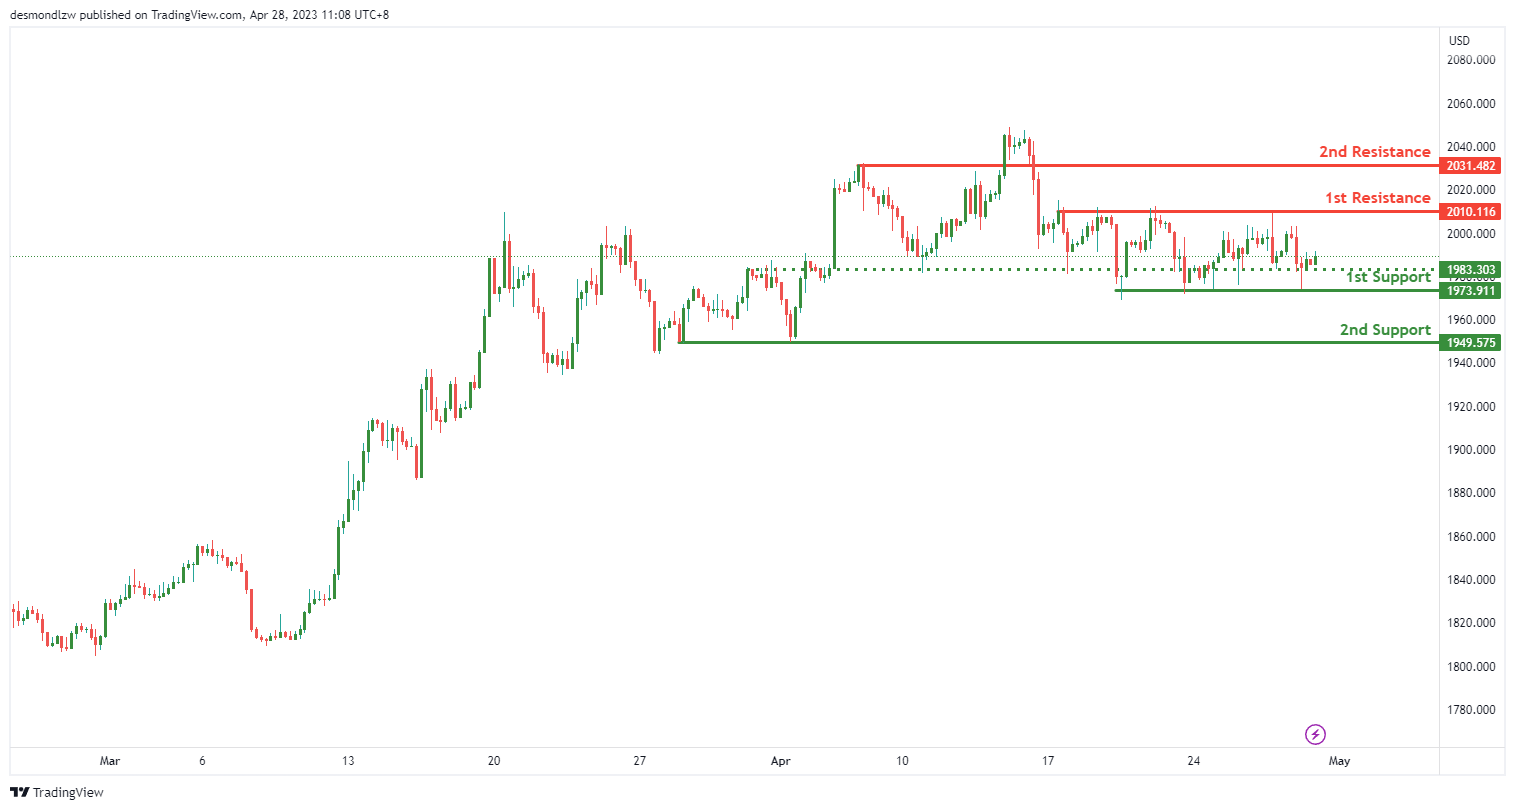
XAU/USD (GOLD):
The XAU/USD chart is displaying bullish momentum, with potential for a bullish continuation towards the first resistance level at 2010.00. As of writing, the price is trading at 1989.18, which is above the Ichimoku cloud, indicating a bullish momentum.
There are two strong support levels identified on the chart. The first support level is at 1973.91, which is a multi-swing low support. This support level is a good point to look out for potential price bounces. The second support level is at 1949.57, which is also a multi-swing low support. If the price were to drop below the first support level, this second support level could provide a good bounce point for prices to reverse back up.
In terms of resistance levels, there are two strong levels to watch out for. The first resistance level is at 2010.00, which is a multi-swing high resistance. This resistance level could provide a good point to look out for potential price reversals. If the price were to break above the first resistance level, it could potentially rise towards the second resistance level at 2031.48. This level is also a pullback resistance, indicating potential for further bullish momentum.
There is also an intermediate support level at 1983.30, which is an overlap support. This level could potentially provide a good point to watch out for a bullish continuation towards the first resistance level.


