
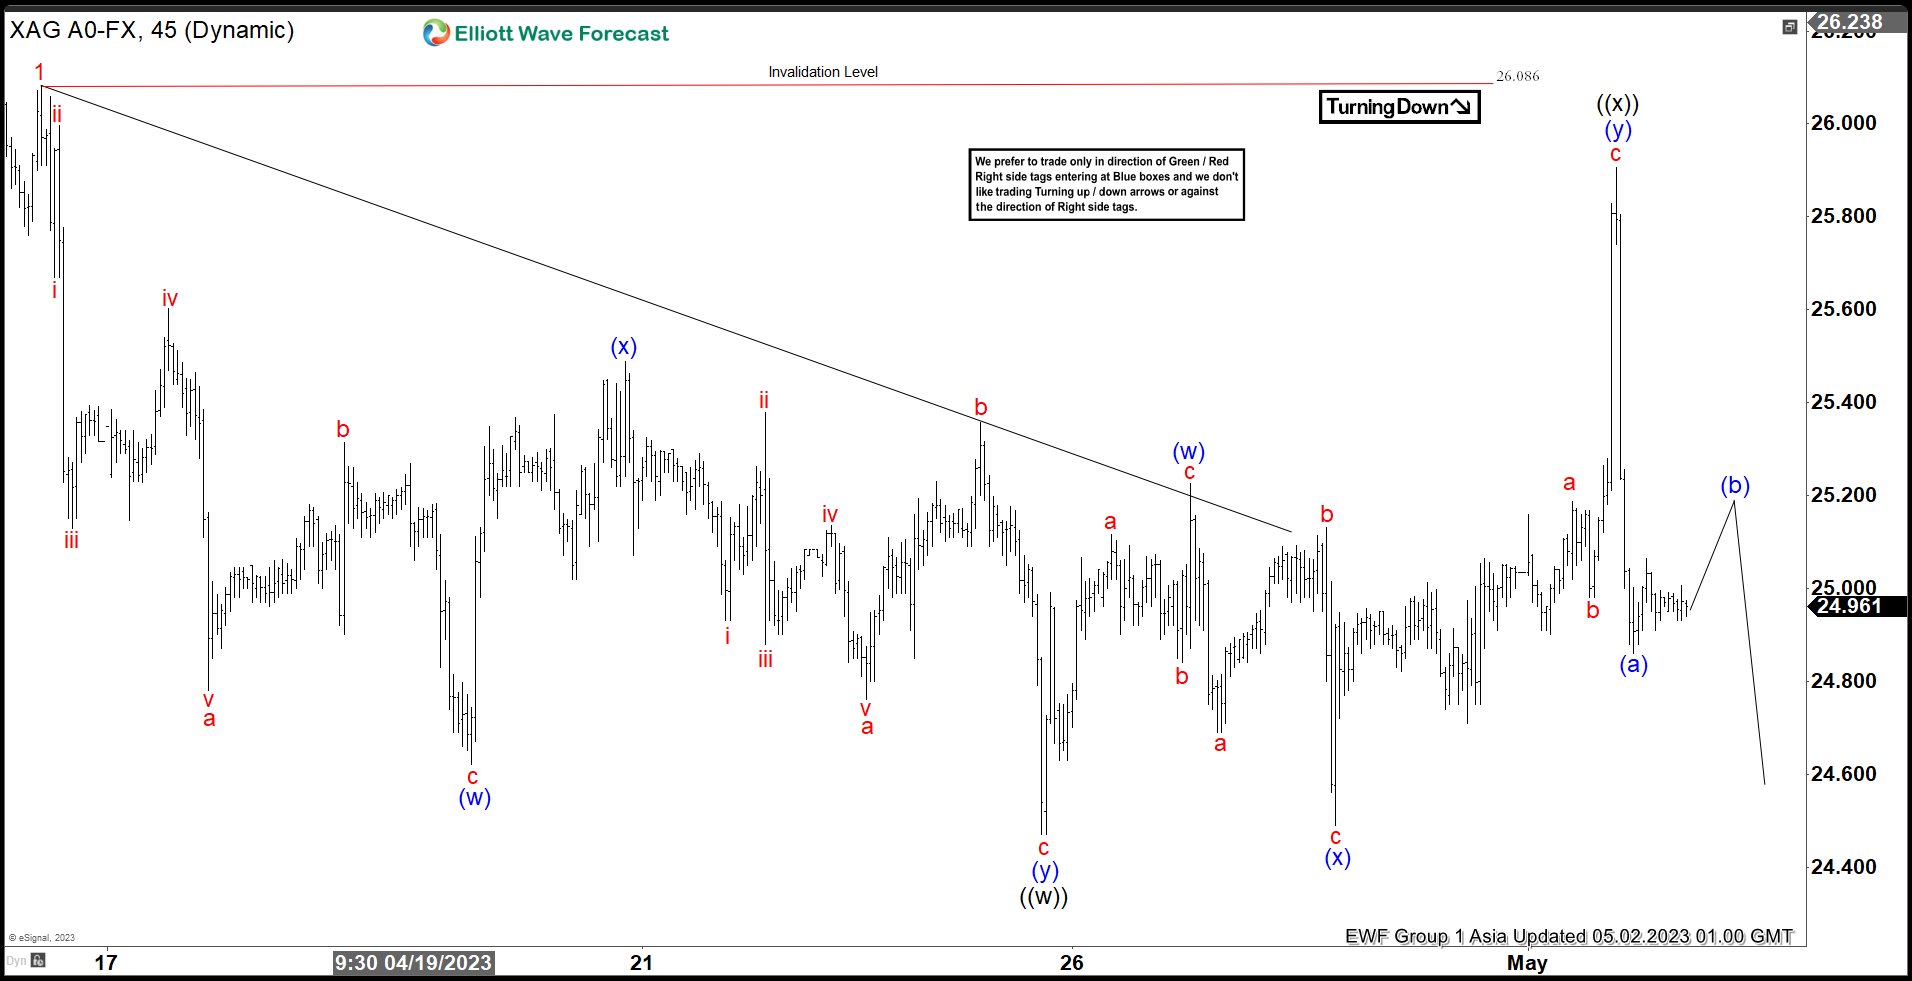
Silver (XAGUSD) ended cycle from 3.10.2023 with wave 1 at 26.08 as the 45 minutes chart below shows. The metal is now correcting cycle from 3.10.2023 low in wave 2. Internal subdivision of wave 2 is unfolding as a double three Elliott Wave structure. Down from wave 1, wave a ended at 24.78 and wave b rally ended at 25.31. Wave c lower ended at 24.62 which completed wave (w). Corrective rally in wave (x) ended at 25.48. The metal resumes lower in wave (y) with internal subdivision as a zigzag. Down from wave (x), wave a ended at 24.76 and wave b ended at 25.35. Wave c lower ended at 24.47 which completed wave (y) and ((w)) in higher degree.
From there, the metal formed wave ((x)) connector with internal subdivision as a double three in lesser degree. Up from wave ((w)), wave (w) ended at 25.22 and pullback in wave (x) ended at 24.49. Wave (y) higher ended at 25.9 which completed wave ((x)) in higher degree. The metal then turns lower in wave ((y)) with internal subdivision as a zigzag. Down from wave ((x)), wave (a) ended at 24.86. Expect rally in wave (b) to fail in 3, 7, or 11 swing for further downside. Potential target lower is 100% – 161.8% Fibonacci extension of wave ((w)) which comes at 23.31 – 24.29 area. Near term, as far as pivot at 26.08 high stays intact, expect rally to fail in 3, 7, 11 swing for further downside.
Silver 45 Minute Elliott Wave Chart
XAGUSD Elliott Wave Video


By loading the video, you agree to YouTube’s privacy policy.
Learn more

 Pullback to Find Support")


 Looking to Extend Higher in a Nest")


%20ended%20cycle%20from%203.10.2023%20with%20wave%201%20at%2026.08%20as%20the%2045%20minutes%20chart%20below%20shows.%20The%20metal%20is%20now%20correcting%20cycle%20from%203.10.2023%20low%20in%20wave%202.%20Internal%20subdivision%20of%20wave%202%20is%20unfolding%20as%20a%20double%20three%20Elliott%20Wave%20structure.%20Down%20from%20wave%201,%20wave%20a%20ended%20at%2024.78%20and%20wave%20b%20rally%20ended%20at%2025.31.%20Wave%20c%20lower%20ended%20at%2024.62%20which%20completed%20wave%20(w).%20Corrective%20rally%20in%20wave%20(x)%20ended%20at%2025.48.%20The%20metal%20resumes%20lower%20in%20wave%20(y)%20with%20internal%20subdivision%20as%20a%20zigzag.%20Down%20from%20wave%20(x),%20wave%20a%20ended%20at%2024.76%20and%20wave%20b%20ended%20at%2025.35.%20Wave%20c%20lower%20ended%20at%2024.47%20which%20completed%20wave%20(y)%20and%20((w))%20in%20higher%20degree.)