
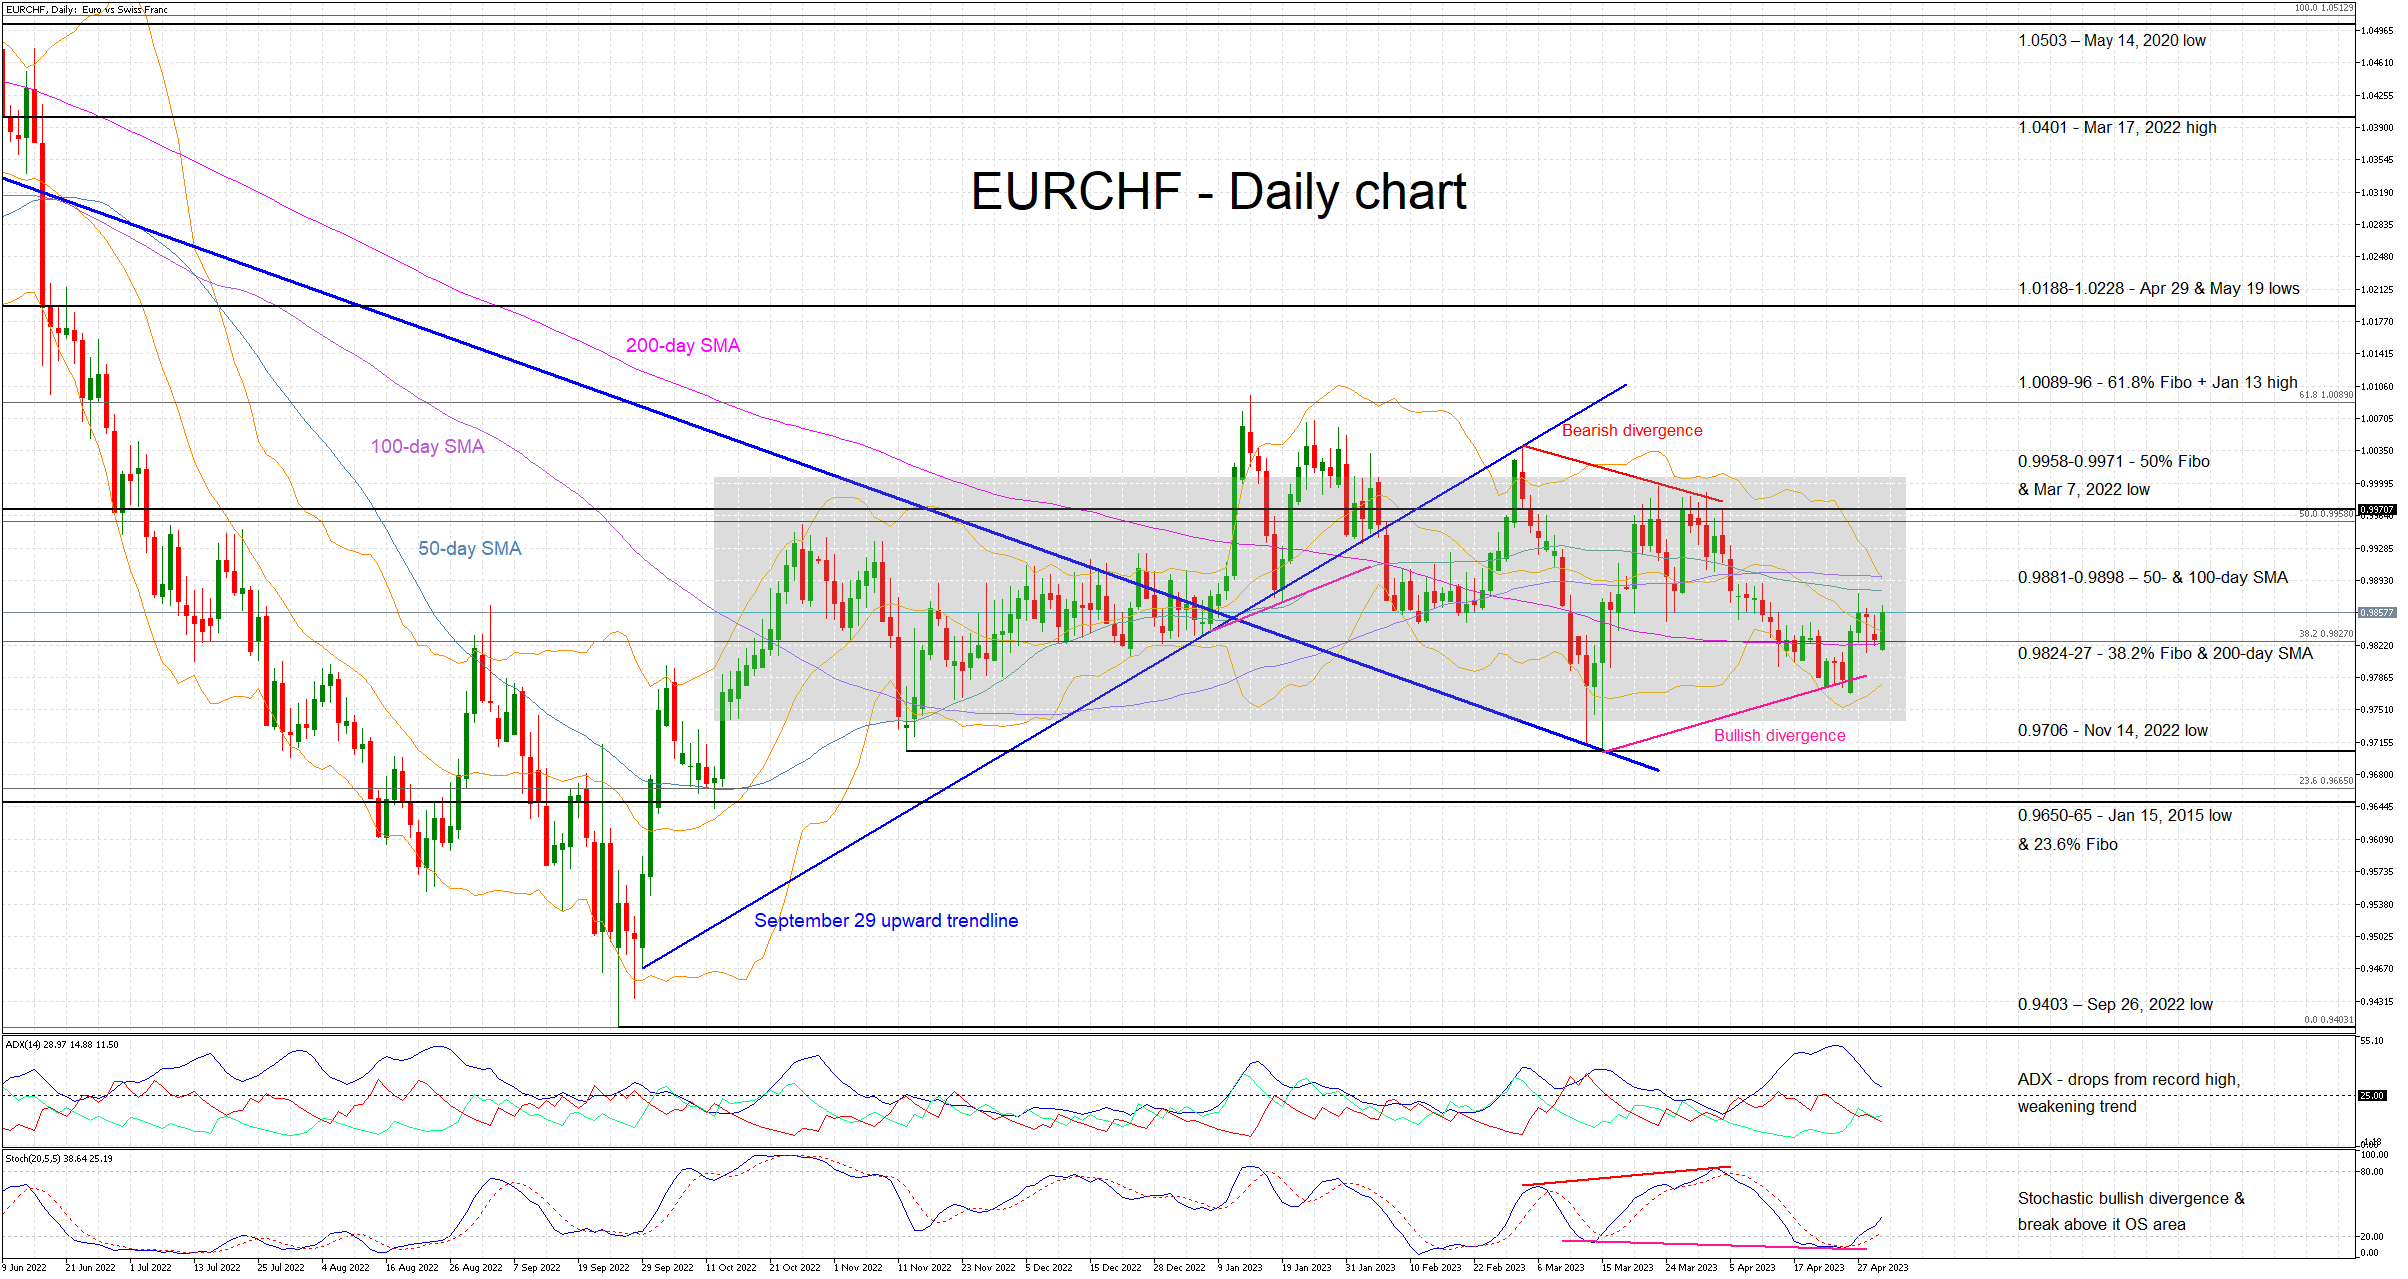
EURCHF is edging higher today, bouncing off a support area defined by the 200-day simple moving average (SMA) and the 38.2% Fibonacci retracement of the June 9, 2022 – September 26, 2022 downtrend respectively. The recent upleg could be the product of the recent bullish divergence that formed between the EURCHF lows and the stochastic oscillator, which has the potential to further impact price action.
A smile has most likely appeared on the bulls’ faces, especially if one adds the stochastic’s recent move. It has broken above its moving average and its oversold area, and it is moving higher in a vertical fashion. However, the Average Directional Movement Index (ADX) is just a tad above its 25-threshold, pointing to a weakening trend. Nevertheless, it is worth noting that the SMAs’ convergence and the relative tightening of the Bollinger bands remain in play at this juncture.
Should the bulls decide to push the market higher, the next key resistance area will come at the 50- and 100-day SMAs at the 0.9881-0.9898 area. The 61.8% Fibonacci retracement and the January 13, 2023 high at the 1.0089-1.0096 range could then prove tougher to crack.
On the other hand, the bears would have to deal with the 0.9824-27 range first, populated by the 38.2% Fibonacci retracement and 200-day SMA. The lower boundary of the current rectangle at 0.9741 comes next, very close to the November 14, 2022 low at 0.9706 that appears to be a stronger support area, as seen at the mid-March breakout.
To sum up, EURCHF bulls might feel a bit more confident on the back of the current stochastic oscillator move. But the overall technical picture remains mixed, especially as the price action continues to be confined by the recent rectangle.


 Pullback to Find Support")


%20and%20the%2038.2%%20Fibonacci%20retracement%20of%20the%20June%209,%202022%20%E2%80%93%20September%2026,%202022%20downtrend%20respectively.%20The%20recent%20upleg%20could%20be%20the%20product%20of%20the%20recent%20bullish%20divergence%20that%20formed%20between%20the%20EURCHF%20lows%20and%20the%20stochastic%20oscillator,%20which%20has%20the%20potential%20to%20further%20impact%20price%20action.%C2%A0)