
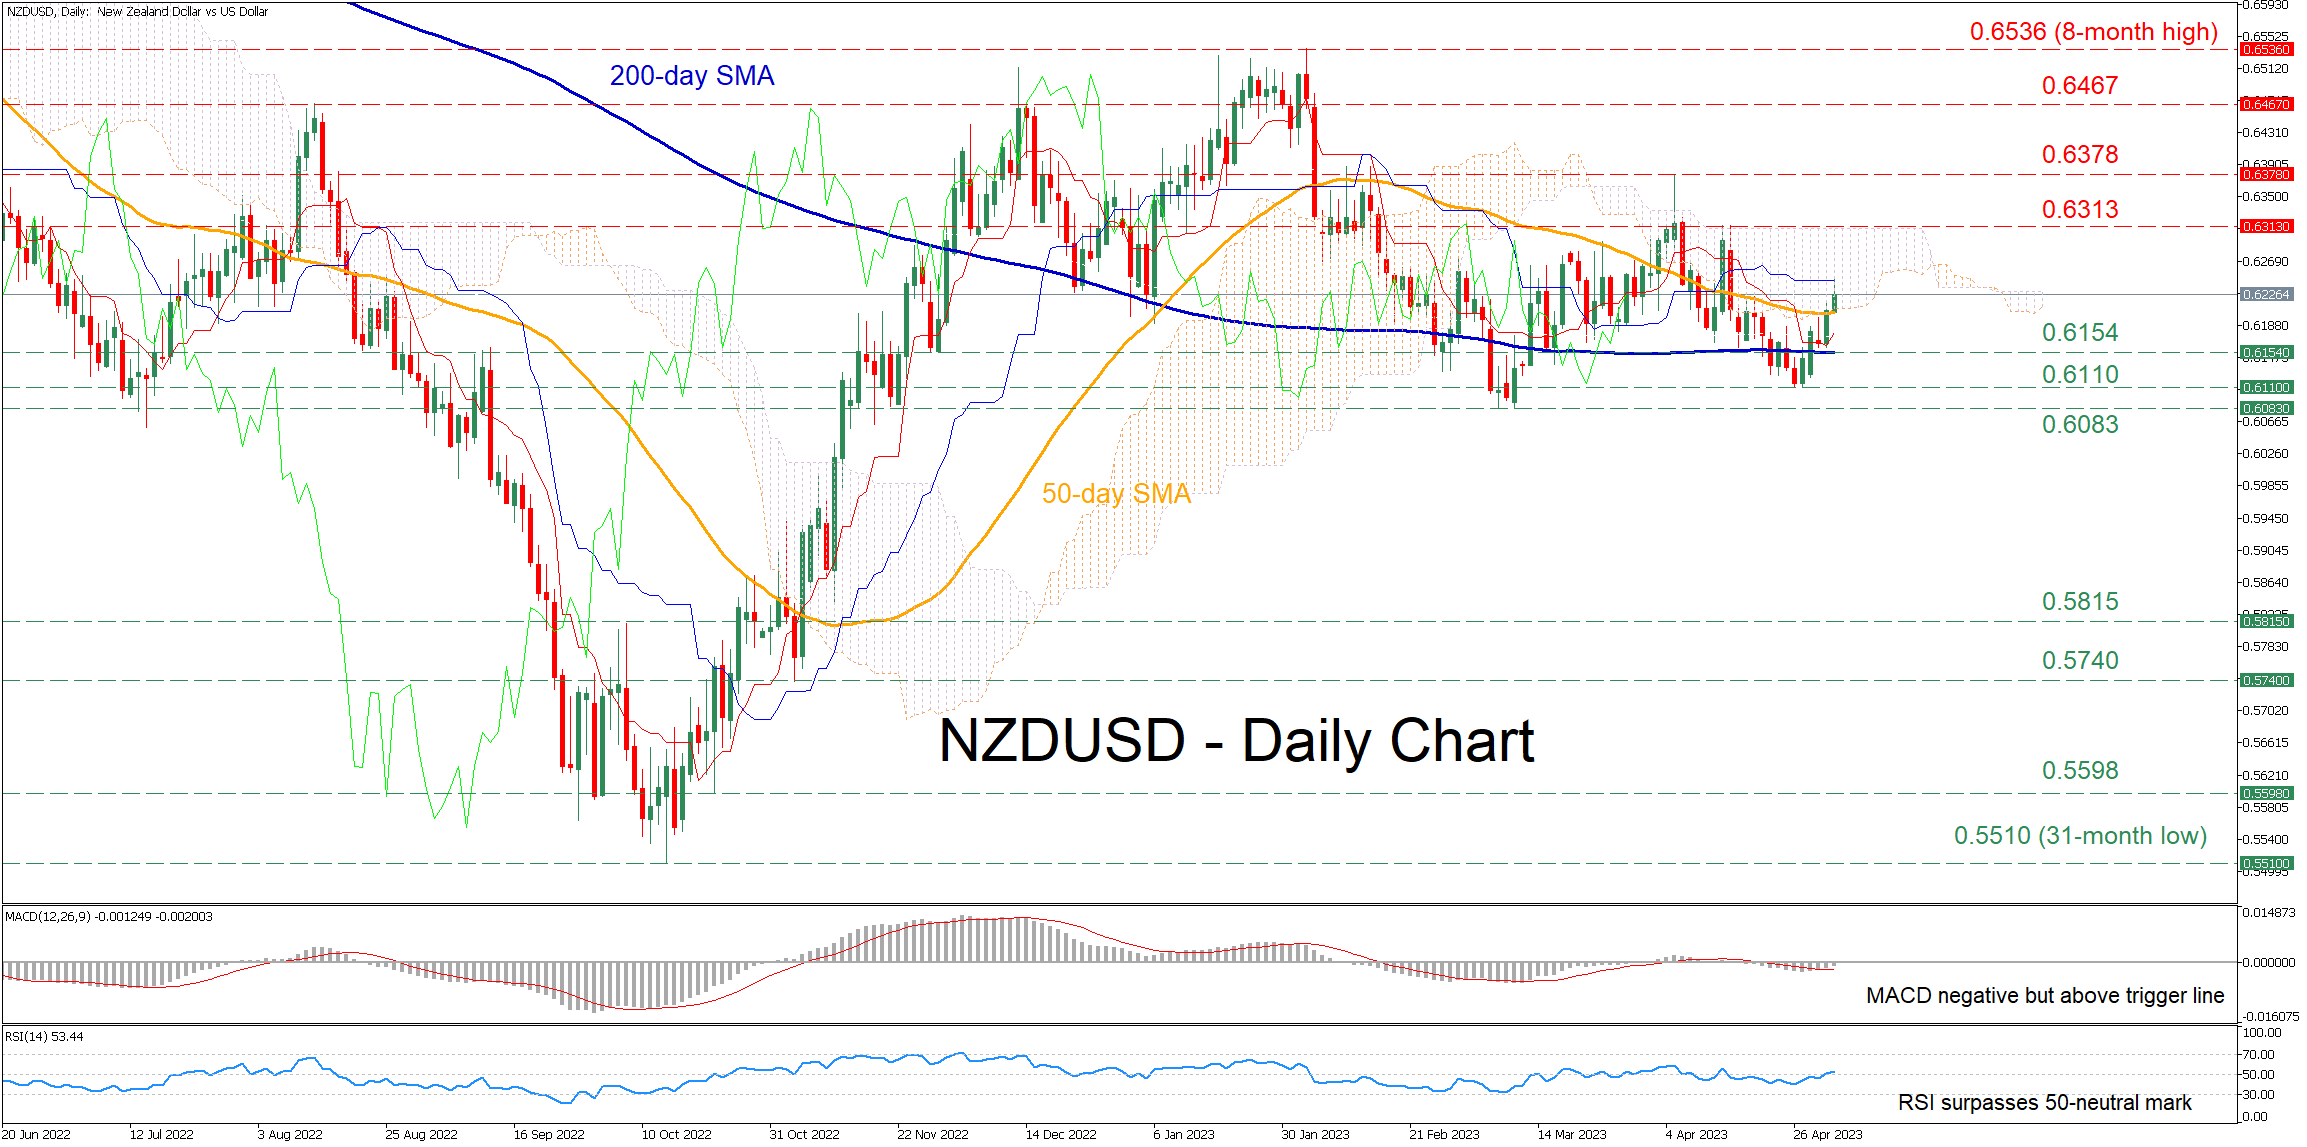
NZDUSD had been steadily gaining ground after its latest retreat came to a halt at 0.6154 in late April. Moreover, the pair has already claimed crucial levels, jumping above both its 50- and 200-day simple moving averages (SMAs), while also entering within the Ichimoku cloud.
The momentum indicators are reflecting a cautiously positive tone. Specifically, the MACD histogram has jumped above its trigger line but remains below zero, while the RSI surpassed its 50-neutral threshold.
Should buying pressures persist, the pair might edge higher to test the recent resistance region of 0.6313. Climbing above that zone, the price could extend its advance towards the April peak of 0.6378. A violation of that region could set the stage for the August high of 0.6467.
Alternatively, if the price reverses lower and falls below its 50-day SMA, the 200-day SMA at 0.6154 could act as the first line of defense. If that barricade fails, the spotlight could turn towards the April low of 0.6110 before the 2023 bottom of 0.6083 appears on the radar. Further declines might then cease at the 0.5815 hurdle.
Overall, NZDUSD’s short-term technical picture has improved drastically after the pair’s latest bounce-off the April low. Therefore, the rebound could resume in the case that the 50-day SMA caps any downside moves.


,%20while%20also%20entering%20within%20the%20Ichimoku%20cloud.)