
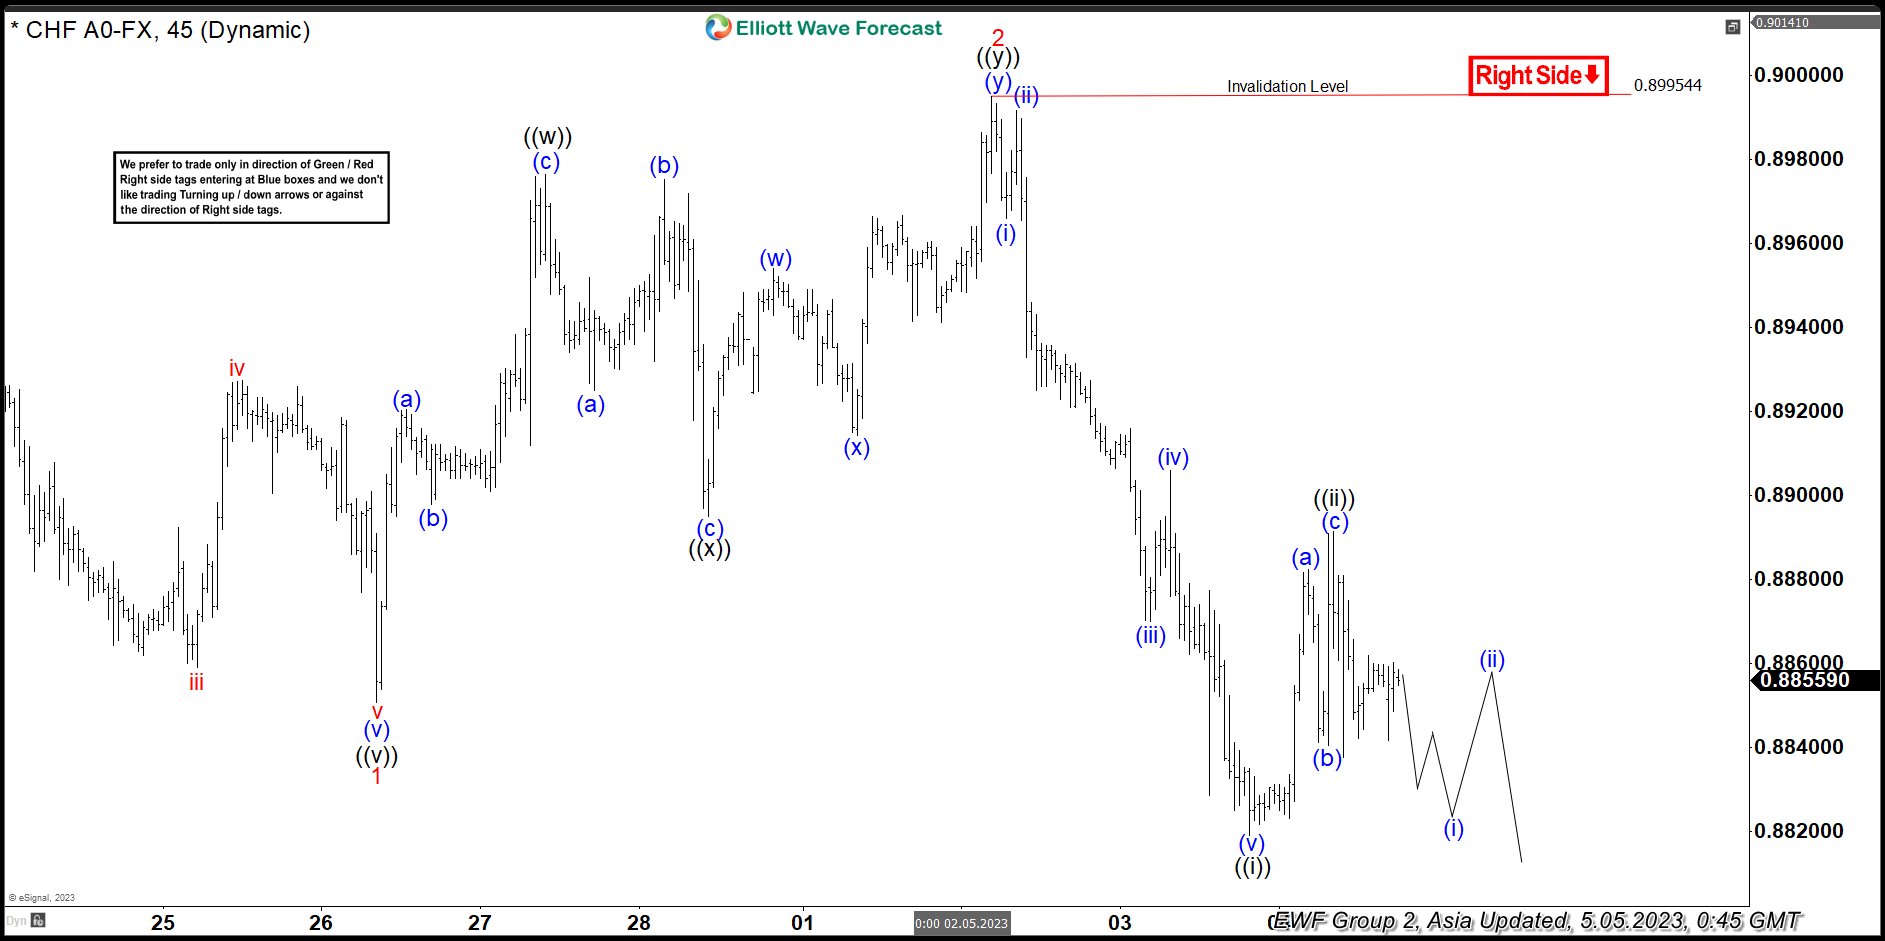
The 45 minutes chart below shows $USDCHF ended wave 1 at 0.885 and rally in wave 2 ended at 0.899. Internal subdivision of wave 2 unfolded as a double three Elliott Wave structure. Up from wave 1, wave (a) ended at 0.892 and wave (b) ended at 0.8898. Wave (c) higher ended at 0.8976 which completed wave ((w)). Pullback in wave ((x)) ended at 0.8895 with internal subdivision as a zigzag. Down from wave ((w)), wave (a) ended at 0.8925, wave (b) ended at 0.8975, and wave (c) lower ended at 0.8895. This completed wave ((x)) in higher degree. Wave ((y)) higher unfolded as a double three structure. Up from wave ((x)), wave (w) ended at 0.8954, wave (x) ended at 0.8914, and wave (y) ended at 0.899. This completed wave ((y)) of 2 in higher degree.
Pair has resumed lower in wave 3 and broken below wave 1 at 0.885. This confirms the next leg lower has started. Down from wave 2, wave (i) ended at 0.8966 and wave (ii) rally ended at 0.899. Pair turns lower in wave (iii) towards 0.887 and rally in wave (iv) ended at 0.89. It then extends lower again in wave (v) towards 0.8822 which completed wave ((i)). Rally in wave ((ii)) ended at 0.8891 with internal subdivision as a zigzag structure. Up from wave ((i)), wave (a) ended at 0.888, pullback in wave (b) ended at 0.884, and wave (c) higher ended at 0.88914. This completed wave ((ii)) in higher degree. Near term, as far as pivot at 0.899 stays intact, expect rally to fail in 3, 7, 11 swing for further downside.
USDCHF 45 Minutes Elliott Wave Chart
USDCHF Elliott Wave Video


By loading the video, you agree to YouTube’s privacy policy.
Learn more


%20ended%20at%200.892%20and%20wave%20(b)%20ended%20at%200.8898.%20Wave%20(c)%20higher%20ended%20at%200.8976%20which%20completed%20wave%20((w)).%20Pullback%20in%20wave%20((x))%20ended%20at%200.8895%20with%20internal%20subdivision%20as%20a%20zigzag.%20Down%20from%20wave%20((w)),%20wave%20(a)%20ended%20at%200.8925,%20wave%20(b)%20ended%20at%200.8975,%20and%20wave%20(c)%20lower%20ended%20at%200.8895.%20This%20completed%20wave%20((x))%20in%20higher%20degree.%20Wave%20((y))%20higher%20unfolded%20as%20a%20double%20three%20structure.%20Up%20from%20wave%20((x)),%20wave%20(w)%20ended%20at%200.8954,%20wave%20(x)%20ended%20at%200.8914,%20and%20wave%20(y)%20ended%20at%200.899.%20This%20completed%20wave%20((y))%20of%202%20in%20higher%20degree.)