
Key Highlights
- Bitcoin price started a fresh decline below $29,000.
- BTC traded below a key contracting triangle with support at $28,200 on the 4-hour chart.
- EUR/USD failed to climb further higher and corrected gains.
- The US Consumer Price Index is likely to remain at 5% in April 2023 (YoY).
Bitcoin Price Technical Analysis
Bitcoin price struggled to clear the $30,000 resistance zone. BTC/USD formed a short-term top near $29,650 and started a fresh decline.
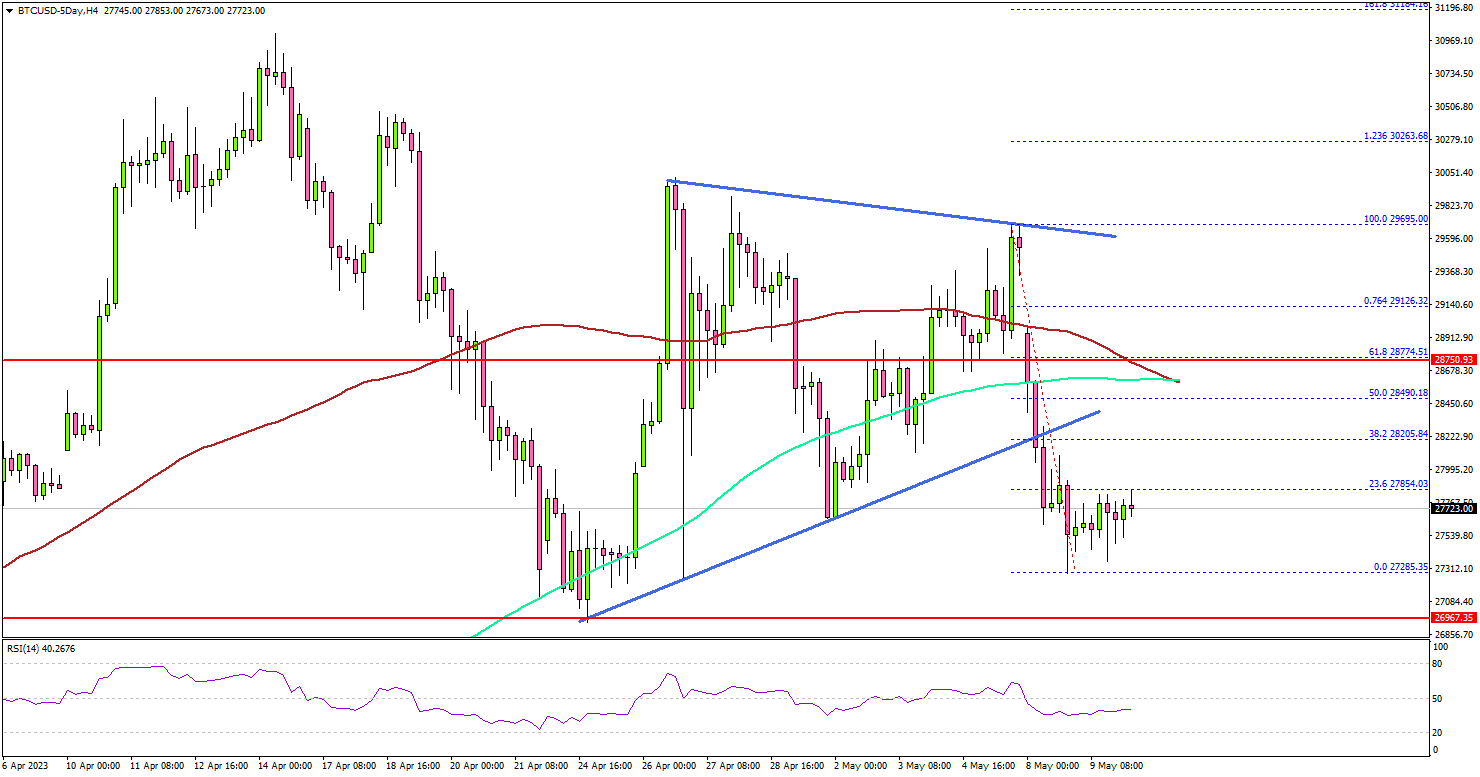
Looking at the 4-hour chart, the price declined below the $29,200 and $29,000 support levels. There was a move below the $28,500 support, the 100 simple moving average (red, 4 hours), and the 200 simple moving average (green, 4 hours).
Besides, BTC traded below a key contracting triangle with support at $28,200 on the same chart. The price is now showing bearish signs and might soon revisit the $27,000 support.
If there is a downside break and a close below $27,000, bitcoin might start another decline in the coming days toward $26,000 or even $25,500.
On the upside, the price is facing resistance near the $28,200 level. The first major resistance is near the $28,750 level (a multi-touch zone) and the 100 simple moving average (red, 4 hours).
A successful close above the $28,750 level might spark another bullish wave. In the stated case, the price may perhaps rise toward the $30,000 level.
Economic Releases
- US Consumer Price Index for April 2023 (MoM) – Forecast +0.4%, versus +0.4% previous.
- US Consumer Price Index for April 2023 (YoY) – Forecast +5%, versus +5% previous.
- US Consumer Price Index Ex Food & Energy for April 2023 (YoY) – Forecast +5.5%, versus +5.6% previous.


