
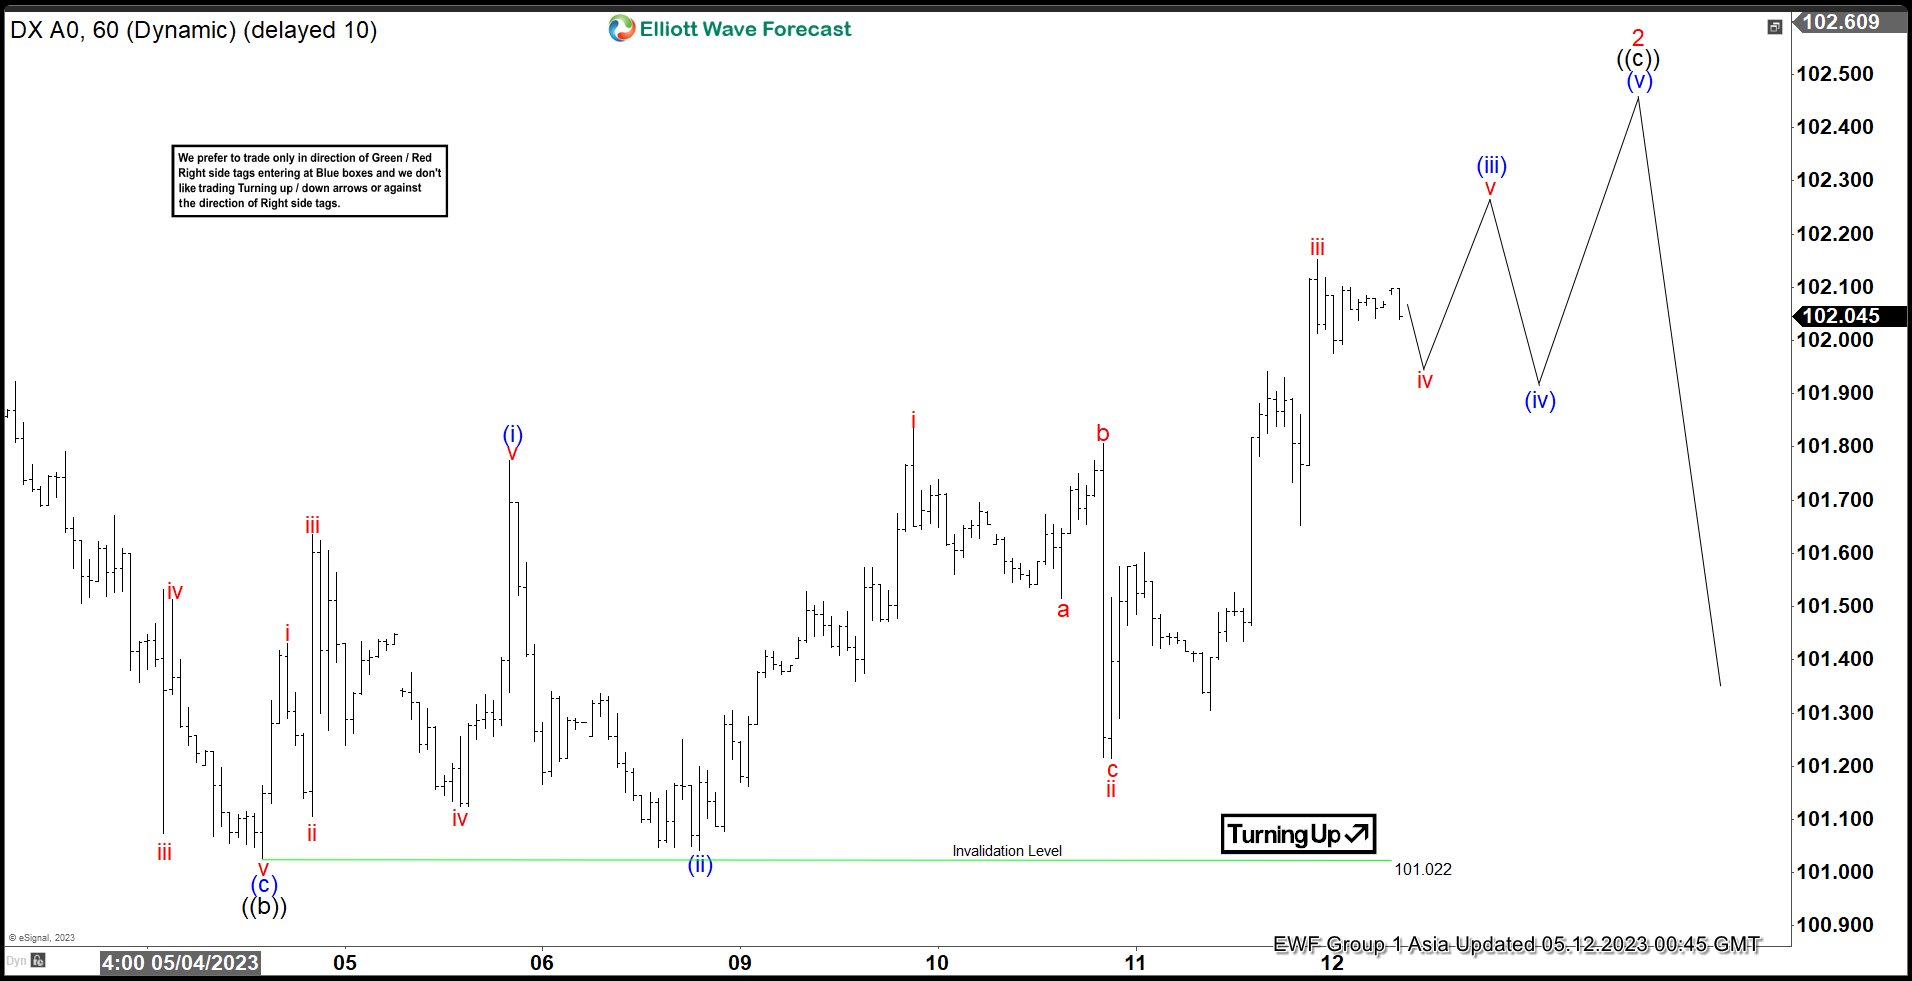
Short Term Elliott Wave View on Dollar Index ($DXY) suggests that the rally from 4.14.2023 low is in progress as a zigzag structure. Up from 4.14.2023 low, wave ((a)) ended at 102.23 and pullback in wave ((b)) ended at 101.02. The 1 hour chart below shows the starting point of wave ((b)). Index is now extending higher in wave ((c)) with internal subdivision as a 5 waves impulse. Up from wave ((b)), wave i ended at 101.43 and wave ii pullback ended at 101.1. Wave iii ended at 101.63, wave iv ended at 101.124, and wave v higher ended at 101.77. This completed wave (i) in higher degree.
From there the Index pullback in wave (ii) which ended at 101.04. The Index then extends higher in wave (iii) as an impulse. Up from wave (ii), wave i ended at 101.83 and pullback in wave ii ended at 101.21. Wave iii ended at 102.15, dips in wave iv ended at 101.97, and now the Index is looking to end wave v which should also complete wave (iii) in higher degree. Afterwards, Index should pullback in wave (iv) to correct cycle from 5.8.2023 low before it resumes higher again. Near term, as far as pivot at 101.02 low stays intact, expect dips to find support in 3, 7, or 11 swing for further upside.
Dollar Index ($DXY) 60 Minutes Elliott Wave Chart
$DXY Elliott Wave Video


By loading the video, you agree to YouTube’s privacy policy.
Learn more


%20suggests%20that%20the%20rally%20from%204.14.2023%20low%20is%20in%20progress%20as%20a%20zigzag%20structure.%20Up%20from%204.14.2023%20low,%20wave%20((a))%20ended%20at%20102.23%20and%20pullback%20in%20wave%20((b))%20ended%20at%20101.02.%20The%201%20hour%20chart%20below%20shows%20the%20starting%20point%20of%20wave%20((b)).%20Index%20is%20now%20extending%20higher%20in%20wave%20((c))%20with%20internal%20subdivision%20as%20a%205%20waves%20impulse.%20Up%20from%20wave%20((b)),%20wave%20i%20ended%20at%20101.43%20and%20wave%20ii%20pullback%20ended%20at%20101.1.%20Wave%20iii%20ended%20at%20101.63,%20wave%20iv%20ended%20at%20101.124,%20and%20wave%20v%20higher%20ended%20at%20101.77.%20This%20completed%20wave%20(i)%20in%20higher%20degree.)