
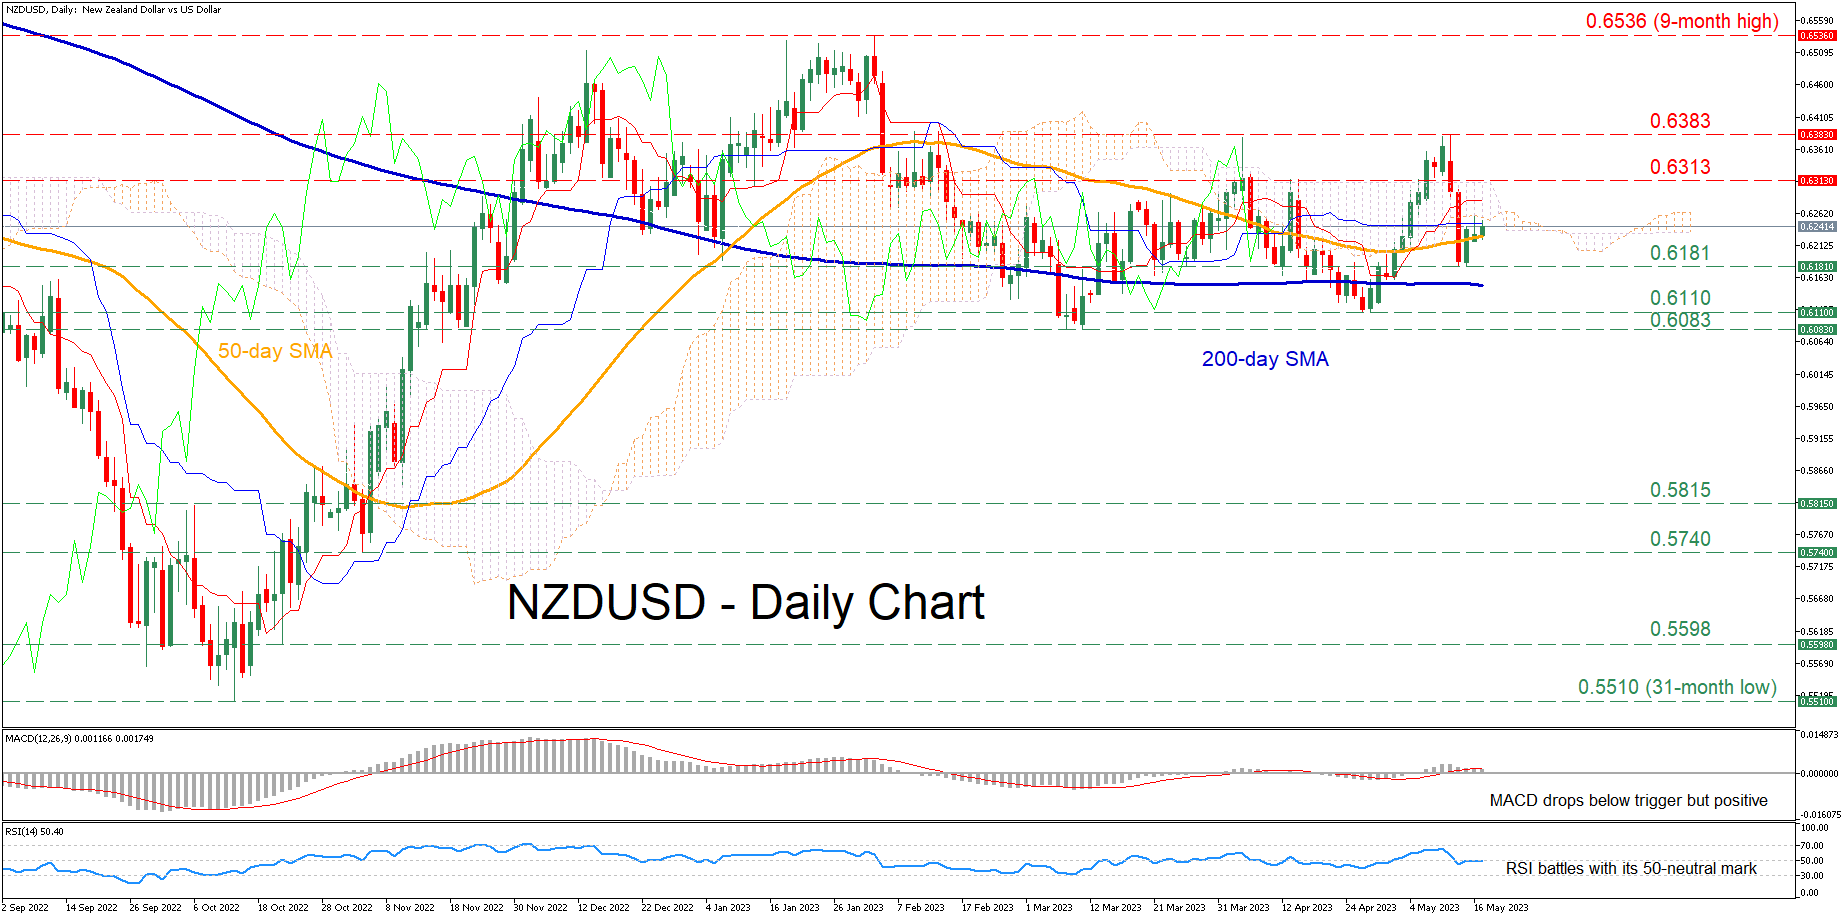
NZDUSD was in a steady short-term uptrend, posting a fresh three-month high of 0.6378 before experiencing a significant pullback. Although the pair managed to halt its retreat and recoup some losses, its attempt for a recovery stalled at the congested region that includes the 50-day simple moving average (SMA) and the lower end of the Ichimoku cloud.
The momentum indicators are reflecting a loss of positive momentum. Specifically, the MACD dropped beneath its red signal line but remains above zero, while the RSI is hovering around its 50-neutral threshold.
Should the selling interest persist, the recent support of 0.6181 could act as the first line of defense. Sliding beneath that floor, the price might descend towards the April low of 0.6110 before the 2023 bottom of 0.6083 gets tested. Further declines might then cease at the 0.5815 hurdle.
On the flipside, if the pair manages to overcome the fortified zone, 0.6313 may prove to be the first barrier for buyers to clear. Conquering this barricade, the bulls could aim for the May peak of 0.6383, which is also a three-month high. A violation of that region could open the door for the nine-month peak of 0.6536.
Overall, NZDUSD has been challenging a crucial technical region in the past couple of daily sessions after its downside correction paused. Therefore, a clear close above both its 50-day SMA and the lower boundary of the Ichimoku cloud is needed to revive bulls’ hopes for a sustained recovery.


%20and%20the%20lower%20end%20of%20the%20Ichimoku%20cloud.)