
EURUSD strengthened its positive momentum on Thursday, rising as high as 1.0758 despite disappointing GDP data out of the eurozone.
The market structure has improved in the four-hour chart, with the pair marking a higher high at 1.0778 and a higher low at 1.0666, flagging a potential bullish trend reversal.
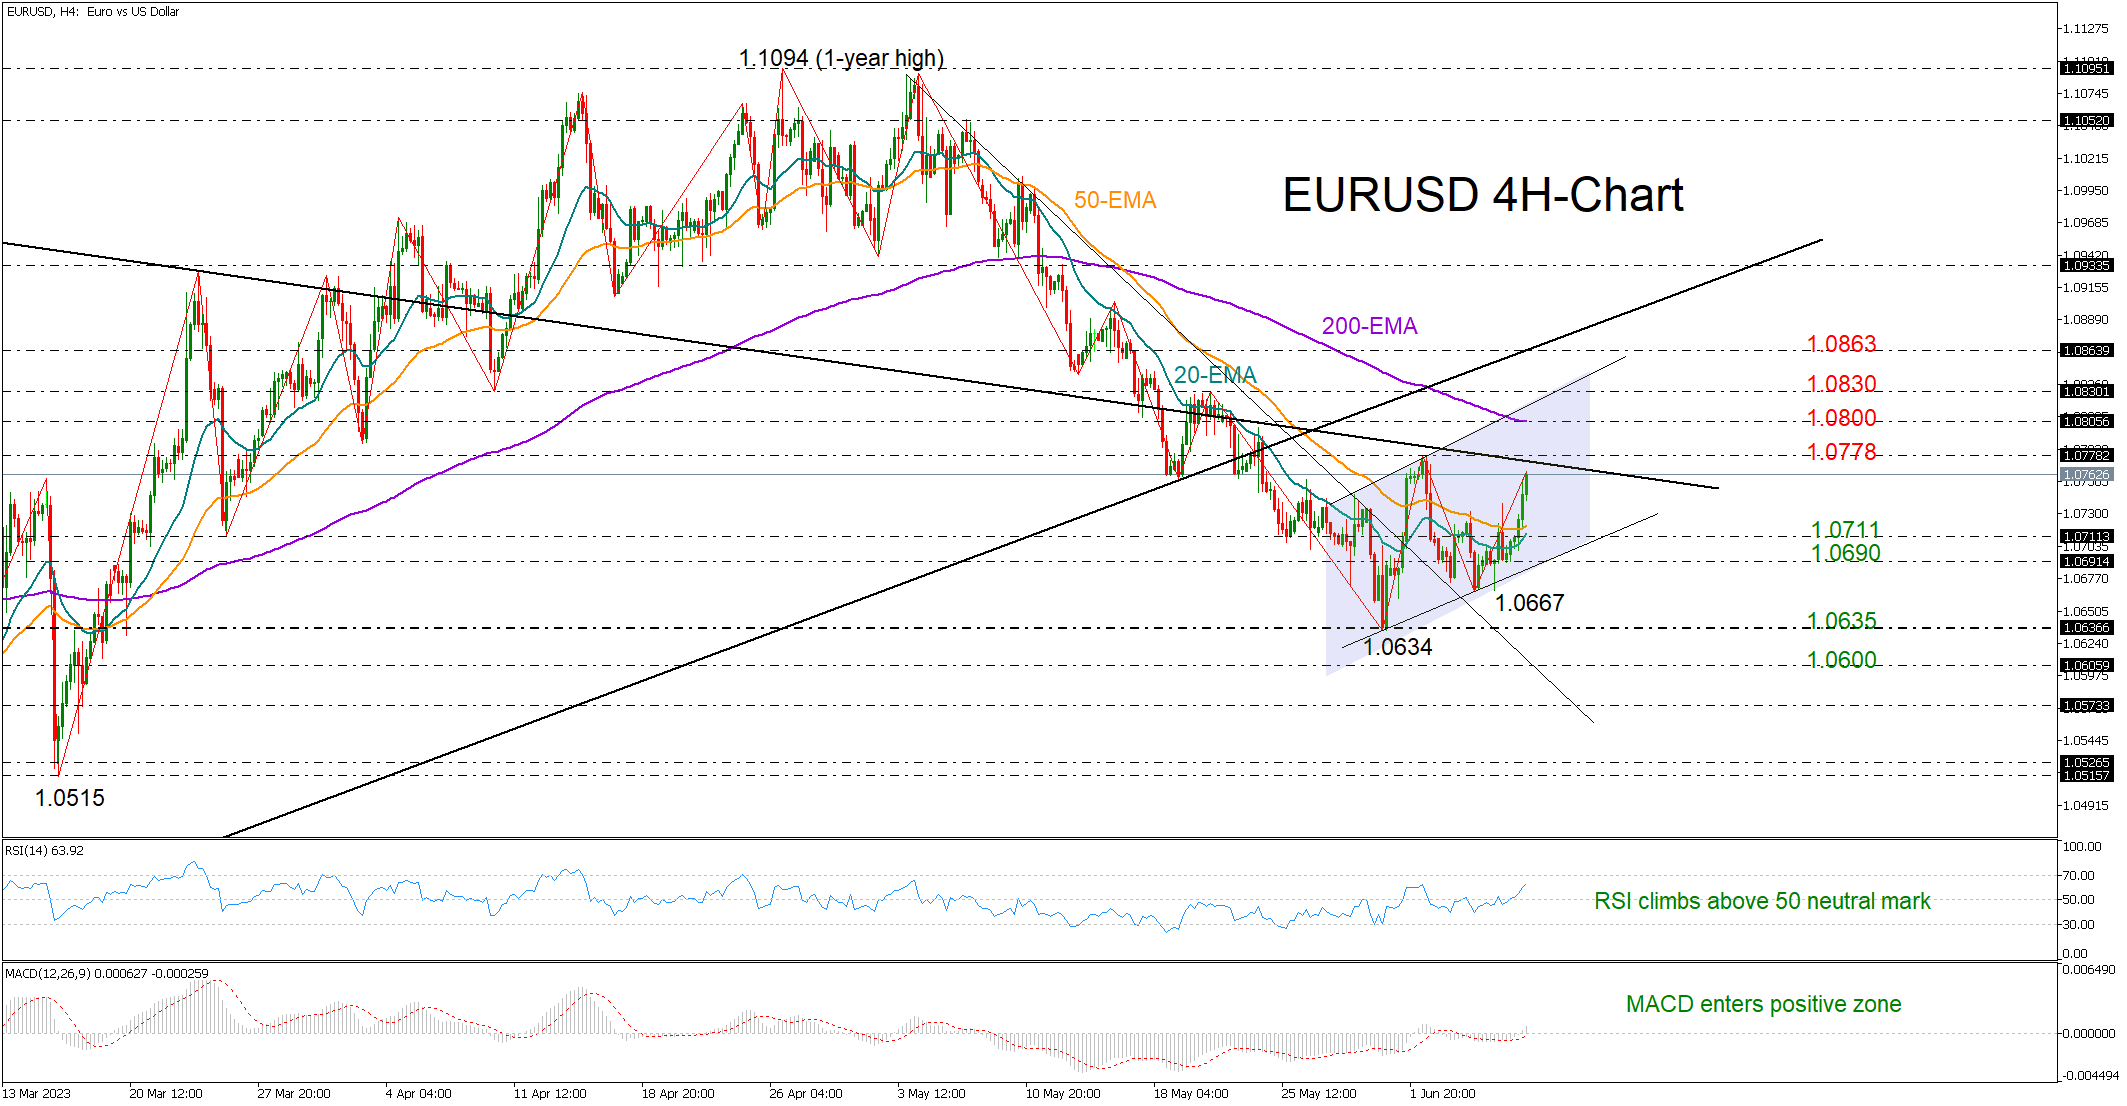
A sustainable recovery above June’s high of 1.0778, where the long-term resistance line from May 2021 is placed, could further boost optimism for a bullish trend reversal, likely bringing the 200-period exponential moving average (EMA) under examination. If the rally stretches above the short-term tentative resistance line and beyond the 1.0830 barrier too, the next stop could be near the broken ascending trendline from the 2022 lows seen around 1.0863.
Encouragingly, the RSI has climbed back above its 50 neutral mark and the MACD has entered the positive area, both reflecting improving sentiment in the market. Still, if the price drifts back below its 20- and 50-period EMAs, selling pressures may intensify towards the short-term support line at 1.0690. A continuation lower would shift the spotlight towards May’s trough of 1.0634, while a step below 1.0600 could confirm an extension towards the 2023 base of 1.0515.
Summing up, May’s sell-off seems to have found a bottom. An extension above June’s high of 1.0778 is now needed to further bolster buying appetite.


