
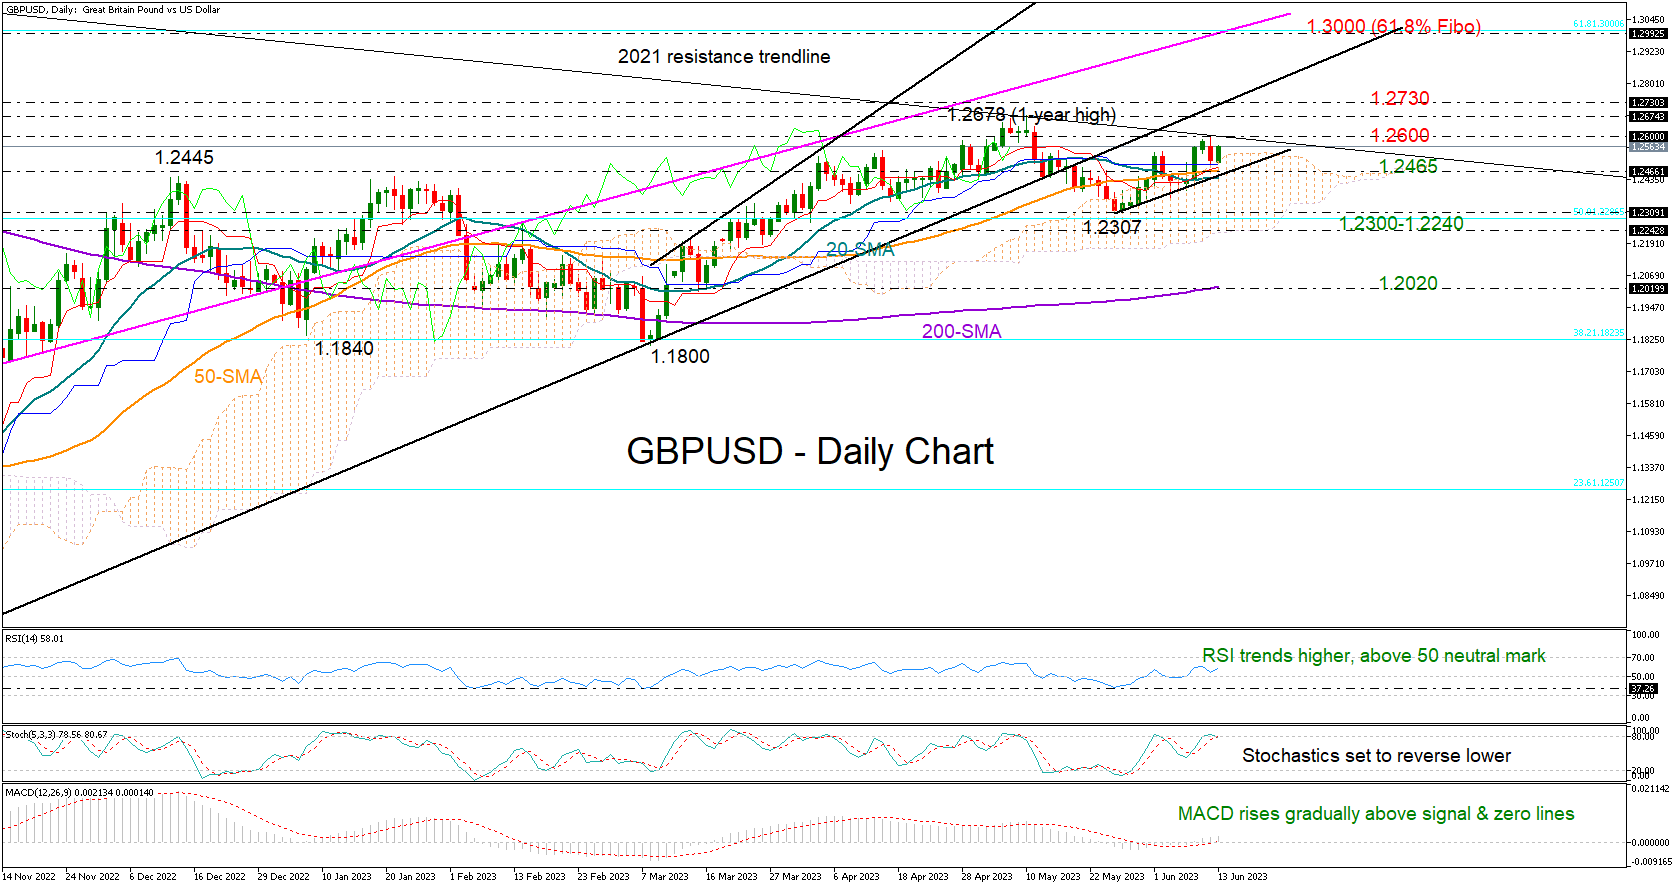
GBPUSD turned red on Monday after marking a one-month high of 1.2598 near the long-term resistance trendline, which has been capping bullish actions since the June 2021 high.
The pair switched back to recovery mode early on Tuesday, with the technical indicators reflecting appetite for a bullish breakout. The RSI is trending higher and is above its 50 neutral mark, while the MACD is gradually strengthening within the positive region and above its red signal line. The fact that the price has avoided a drop inside the Ichimoku cloud is also making additional gains possible.
Yet, only a clear extension above the resistance trendline and the 1.2600 round level could activate fresh buying orders. If that proves to be the case, the bulls may drive the pair straight up to May’s high of 1.2678 and then towards the broken support trendline from the September 2022 low at 1.2730. A continuation higher could pick up pace towards the 1.3000 zone, where the 61.8% Fibonacci retracement of the 1.4248-1.0324 downtrend is placed.
Alternatively, the pair could seek support somewhere between its 20- and 50-day simple moving averages (SMAs) at 1.2465. Failure to rebound there may press the price into the 1.2300-1.2240 territory, where May’s bearish wave bottomed out. The 50% Fibonacci mark and the cloud’s lower boundary are also positioned in the same region. Therefore, a decisive close lower could spark a notable decline towards the 200-day SMA at 1.2020.
All in all, GBPUSD seems to have some extra bullish power in the tank despite a discouraging start to the week. An advance above 1.2600 could extend the uptrend to new highs.


