
Key Highlights
- GBP/USD climbed above the 1.2750 and 1.2800 resistance levels.
- A major bullish trend line is forming with support near 1.2765 on the 4-hour chart.
- EUR/USD started a downside correction from the 1.0970 zone.
- Gold price is facing heavy resistance near the $1,965 level.
GBP/USD Technical Analysis
The British Pound started a major increase above the 1.2720 resistance against the US Dollar. GBP/USD settled above 1.2700 to move into a bullish zone.
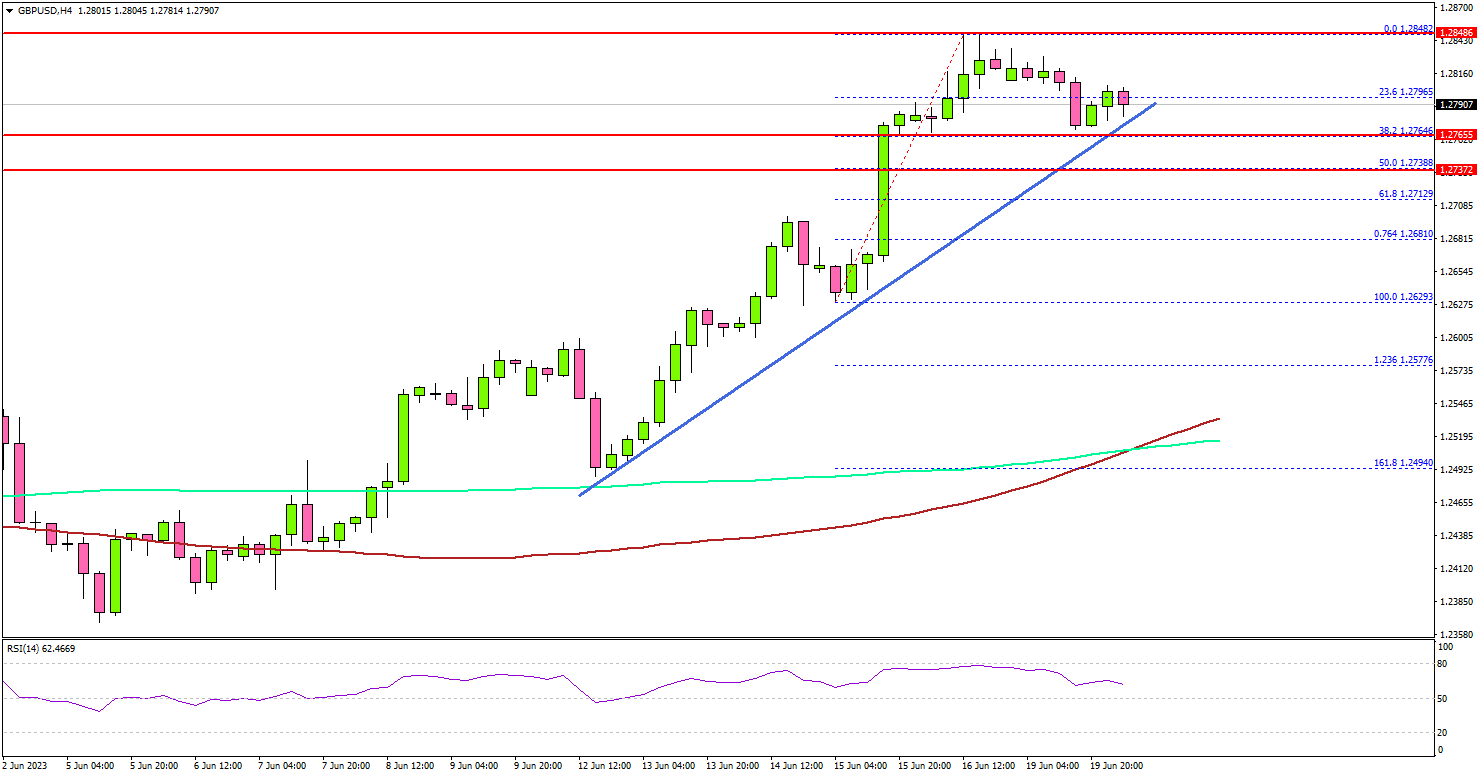
Looking at the 4-hour chart, the pair gained pace above the 1.2800 resistance. It traded as high as 1.2848 and settled well above the 100 simple moving average (red, 4 hours) and the 200 simple moving average (green, 4 hours).
Recently, there was a minor downside correction below 1.2800. The pair dipped below the 23.6% Fib retracement level of the upward move from the 1.2629 swing low to the 1.2848 high.
Immediate support is near the 1.2770 level. There is also a major bullish trend line forming with support near 1.2765 on the same chart. It is close to the 38.2% Fib retracement level of the upward move from the 1.2629 swing low to the 1.2848 high.
The next major support is near the 1.2715 level. If there is a downside break below the 1.2715 support, the pair could decline toward the 1.2650 support.
Any more losses might send GBP/USD toward 1.2600. If there is a fresh increase, the pair could face resistance near 1.2850. The first major resistance is near the 1.2920 level. If there is a move above the 1.2920 resistance, the pair could rise toward 1.3000.
Looking at EUR/USD, the pair rallied above the 1.0900 resistance zone and recently started a short-term downside correction.
Economic Releases
- Euro Zone Current Account for April 2023 – Forecast €30.1B versus €31.6B previous.


