
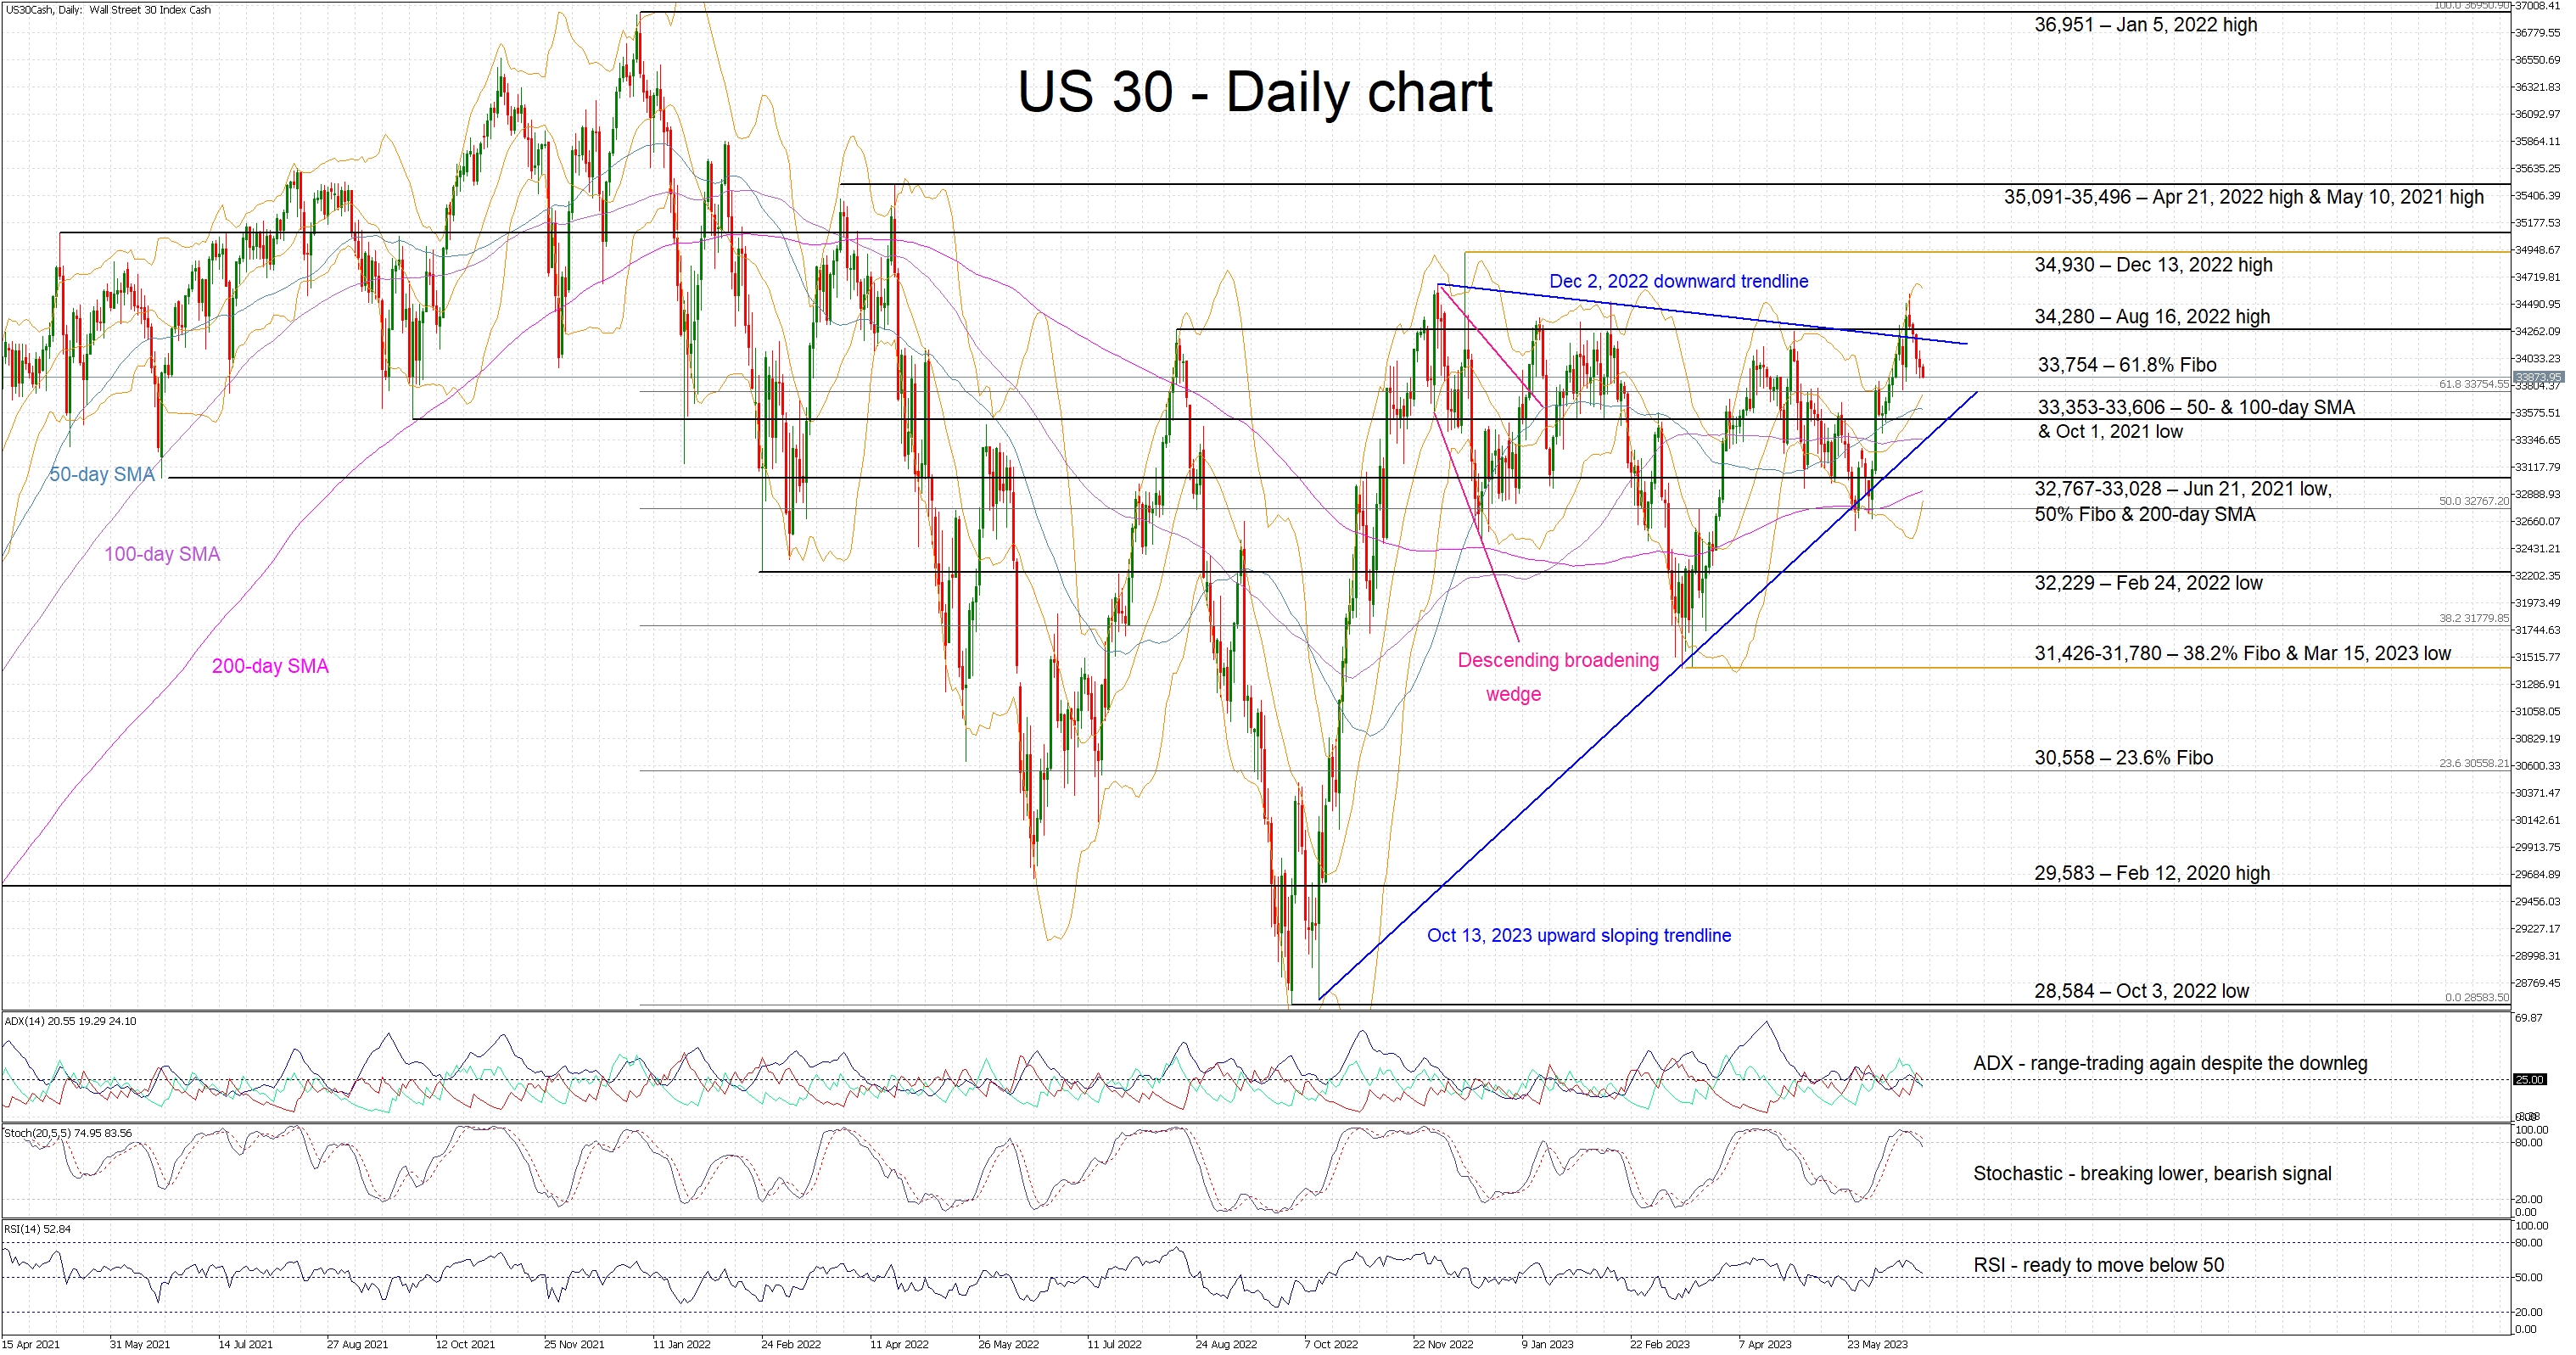
The US 30 cash index has completed five red candles after again failing to decisively rally above 34,280. This level has morphed into a key sentiment area as over the past 10 months the bulls have registered six false breakouts. The US 30 index is currently hovering a tad above the 33,754 level but below the December 2, 2022 downward sloping trendline.
The momentum indicators appear to mostly favour the bears at this juncture. While the Average Directional Movement Index (ADX) is hovering below its 25-threshold and signaling a range-trading market, the RSI is edging lower, well below its recent peak. More importantly, the stochastic has broken below its overbought territory and it is moving lower in an almost vertical fashion.
Should the bears continue to push the index lower and manage to overcome the 61.8% Fibonacci retracement of the January 5, 2022 – October 3, 2022 downtrend at 33,754, they would then target the arguably more important 33,353-33,606 area. The combination of the 50- and 100-day simple moving averages (SMAs) and the October 1, 2021 low means that the bears’ determination would really be put to the test there.
On the flip side, the bulls would love a retest of the August 16, 2022 high at 34,280 but they firstly have to break the December 2, 2022 downward trendline. The December 13, 2022 high at 34,930 would be the next aim, a tad below the busier 35,091-35,496 range defined by the April 21, 2022 and May 10, 2021 highs respectively.
To sum up, the US 30 cash index bulls’ inability to break the 34,280 level has given the bears the opportunity to take control of the market.


