
Short Term Elliott Wave View in Nasdaq (NQ) suggests the rally from 6.27.2023 low is in progress as a 5 waves impulse Elliott Wave structure. Up from 6.27.2023 low, wave ((i)) ended at 15432 and wave ((ii)) pullback ended at 15064.5. Internal subdivision of wave ((ii)) unfolded as a double three structure. Down from wave ((i)), wave (w) ended at 15111.5, wave (x) ended at 15359.75 and wave (y) lower ended at 15064.5. This completed wave ((ii)) in higher degree. The Index has resumed higher in wave ((iii)).
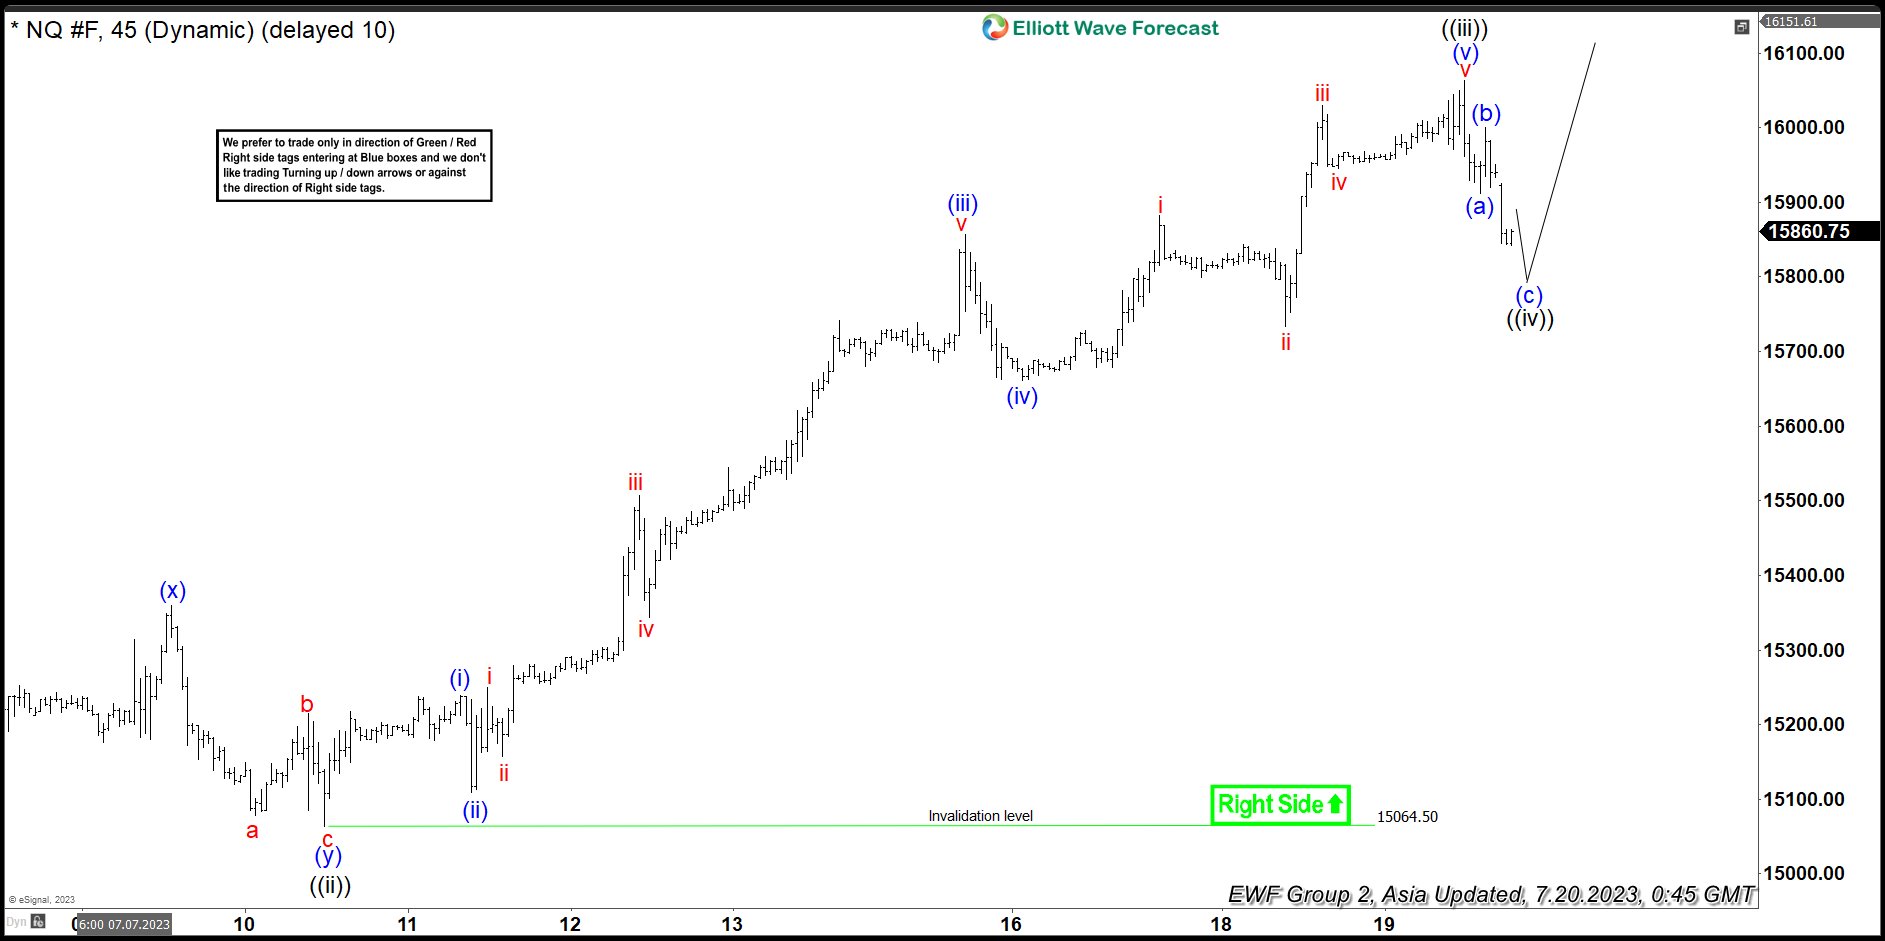
Up from wave ((ii)), wave (i) ended at 15239.75 and pullback in wave (ii) ended at 15109.50. The Index resumes higher in wave (iii) towards 15857.25 and dips in wave (iv) ended at 15661.50. Final leg higher wave (v) ended at 16062.75 which completed wave ((iii)). Pullback in wave ((iv)) is in progress as a zigzag structure. Down from wave ((iii)), wave (a) ended at 15911.25 and wave (b) ended at 16000. Expect wave (c) of ((iv)) to end soon. The Index should then resume higher in wave ((v)) to complete cycle from 6.7.2023 low. Near term, as far as pivot at 15064.5 low stays intact, expect pullback to find support in 3, 7, or 11 swing for further upside.
Nasdaq (NQ) 45 Minutes Elliott Wave Chart
NQ Elliott Wave Video


By loading the video, you agree to YouTube’s privacy policy.
Learn more


%20suggests%20the%20rally%20from%206.27.2023%20low%20is%20in%20progress%20as%20a%205%20waves%20impulse%20Elliott%20Wave%20structure.%20Up%20from%206.27.2023%20low,%20wave%20((i))%20ended%20at%2015432%20and%20wave%20((ii))%20pullback%20ended%20at%2015064.5.%20Internal%20subdivision%20of%20wave%20((ii))%20unfolded%20as%20a%20double%20three%20structure.%20Down%20from%20wave%20((i)),%20wave%20(w)%20ended%20at%2015111.5,%20wave%20(x)%20ended%20at%2015359.75%20and%20wave%20(y)%20lower%20ended%20at%2015064.5.%20This%20completed%20wave%20((ii))%20in%20higher%20degree.%20The%20Index%20has%20resumed%20higher%20in%20wave%20((iii)).)