
The short-term Elliott wave view in S&P 500 (SPX) suggests that the rally from the 3.13.2023 low unfolded as a 5 waves impulse structure. Up from 3.15.2023 low, wave ((i)) ended at $4186.92. Dip in wave ((ii)) ended at $4048.28 low and the rally to $4458.48 high ended wave ((iii)). Down from there, the pullback to 4385.05 low & started the wave ((v)) higher. Up from there, wave (i) ended at $4440.39, and a pullback in wave (ii) ended at $4389.92. Index extends higher in wave (iii) towards $4578.43 and dip in wave (iv) ended at $4527.56 high.
The final leg higher wave (v) ended at $4599.85 high, which completed wave 3 & also the cycle from 3.15.2023 low. Below from there, the index is doing a pullback in wave 4, which is expected to find support in 3, 7, or 11 swings for further upside. Down from wave 3, the pullback is unfolding as Elliott wave zigzag correction where wave ((a)) ended at $4474.55 low. Then wave ((b)) bounce ended at $4519.84 high and ((c)) is expected to extend lower towards $4394.65- $4317.36 100%-161.8% Fibonacci extension area of ((a))-((b)). Also, wave 4 typically ends somewhere at the 23.6 – 38.2% Fibonacci retracement of wave 3. That area comes at $4419.19 – $4308.22, which also coincides with the 100%-161.8% Fibonacci extension area of ((a))-((b)) as well. From there, the Index can find buyers for further upside.
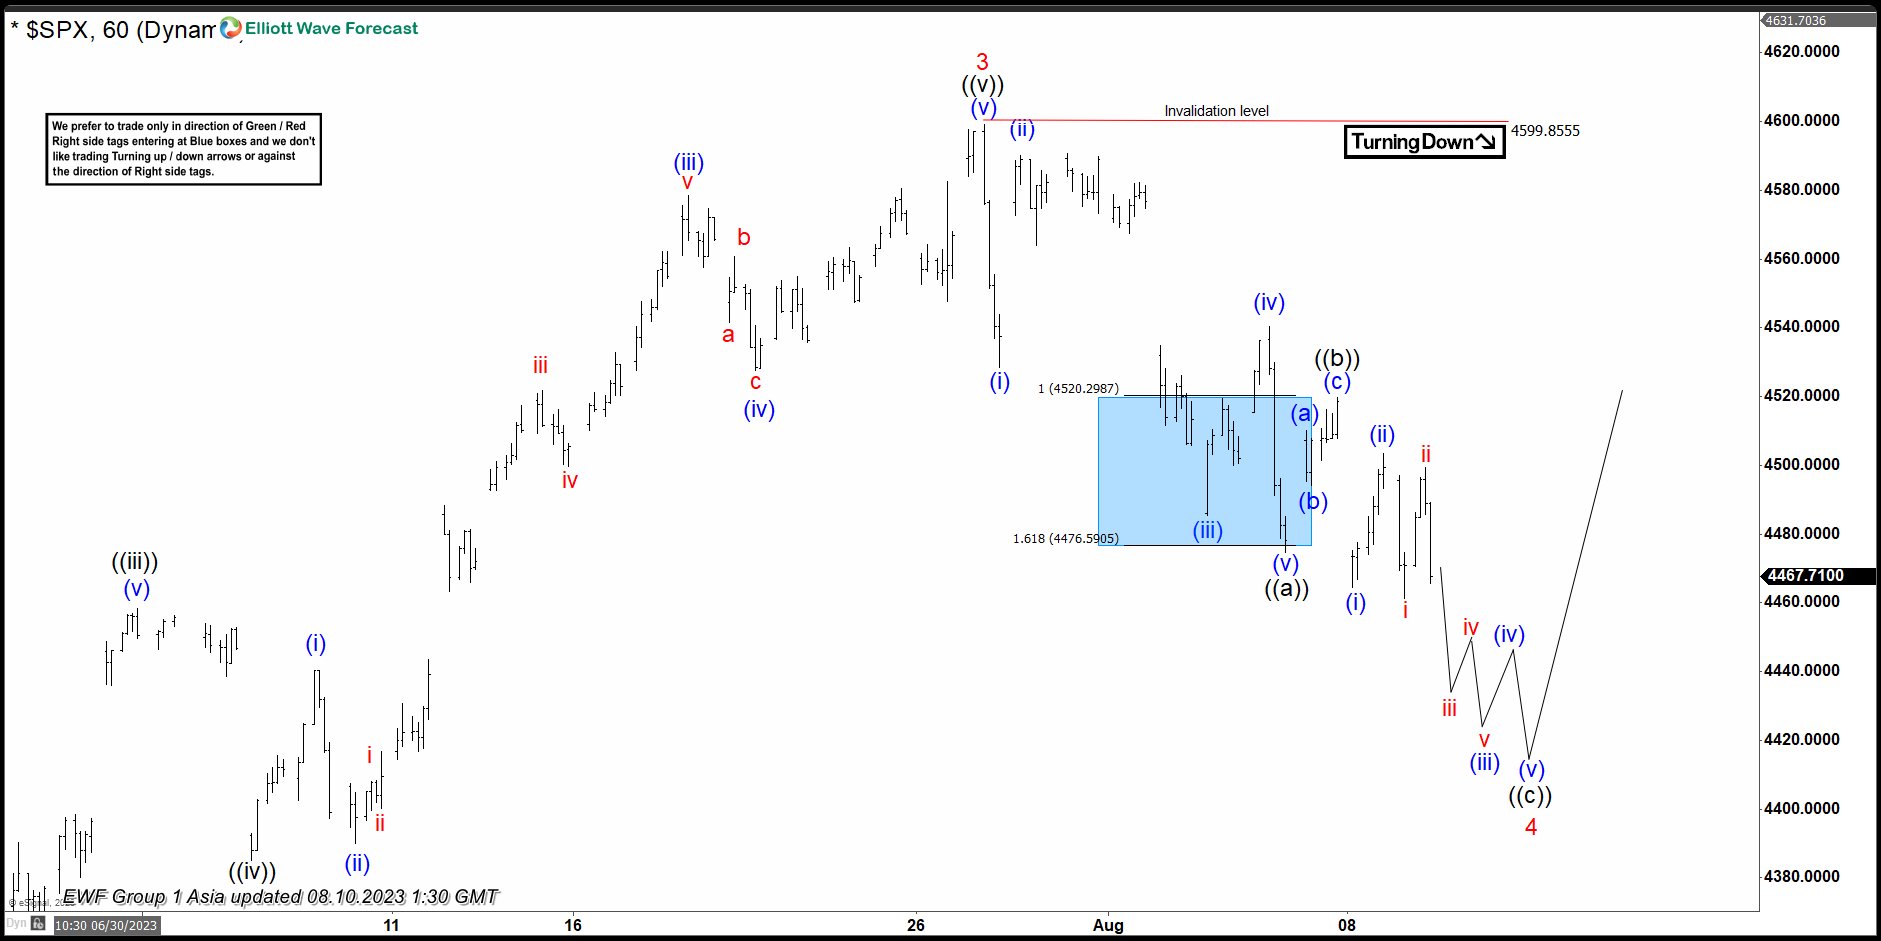
SPX 1 Hour Elliott Wave Chart From 8.10.2023
SPX Elliott Wave Video


By loading the video, you agree to YouTube’s privacy policy.
Learn more


 to Pullback in Wave 4")


