
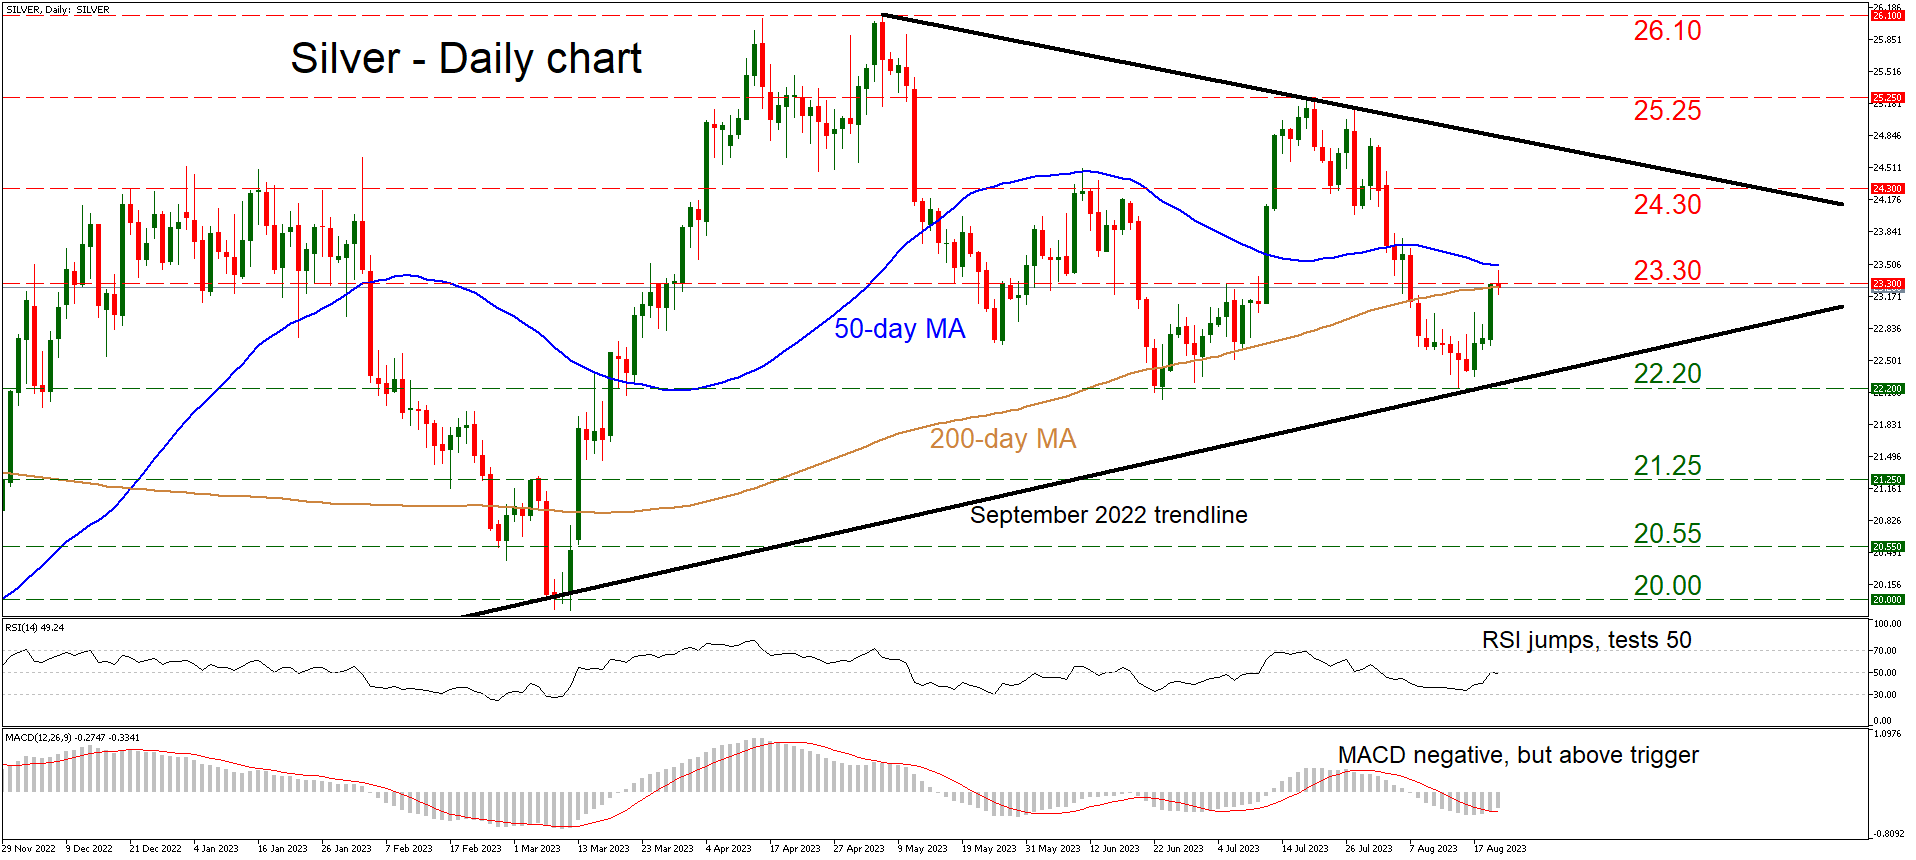
Silver prices are trading above a long-term uptrend line taken from the lows of September, but below a downtrend line drawn from the peaks in May. The combination suggests silver is locked inside a symmetrical triangle pattern, a break of which will likely reveal the next major directional wave.
Momentum oscillators paint a relatively neutral picture. The RSI is testing its 50 level, and although the MACD is negative, it has crossed above its red trigger line. Neither indicator is flashing any clear signals about what’s next in the market.
Buyers seized control this week and pushed prices higher towards the 23.30 region, which encompasses the 200-day moving average (MA). The 50-day MA is just above at 23.50 and could be considered part of the same region. If the bulls finally manage to slice above this congested area, the next target might be the 24.30 zone, which capped several advances back in January.
Now, in case sellers retake the wheel, the first major obstacle on the downside would be the 22.20 barrier. A decisive break below it would violate the long-term uptrend line and therefore shatter the triangle, turning the technical picture negative and opening the door for further declines towards the 21.25 area.
In a nutshell, silver seems neutral at this stage. A break at either side of the triangle is needed to signal the next significant directional move.

 Pullback to Find Support")


 Looking to Extend Higher in a Nest")


