
Key Highlights
- Crude oil price is rising above the $84 and $85 resistance levels.
- A key bullish trend line is forming with support near $84.20 on the 4-hour chart.
- Gold prices might find a strong buying interest near $1,915.
- EUR/USD is consolidating losses below 1.0780.
Crude Oil Price Technical Analysis
Crude oil price started a steady increase after a close above $80 against the US Dollar. The price rallied above the $82 and $84 resistance levels.
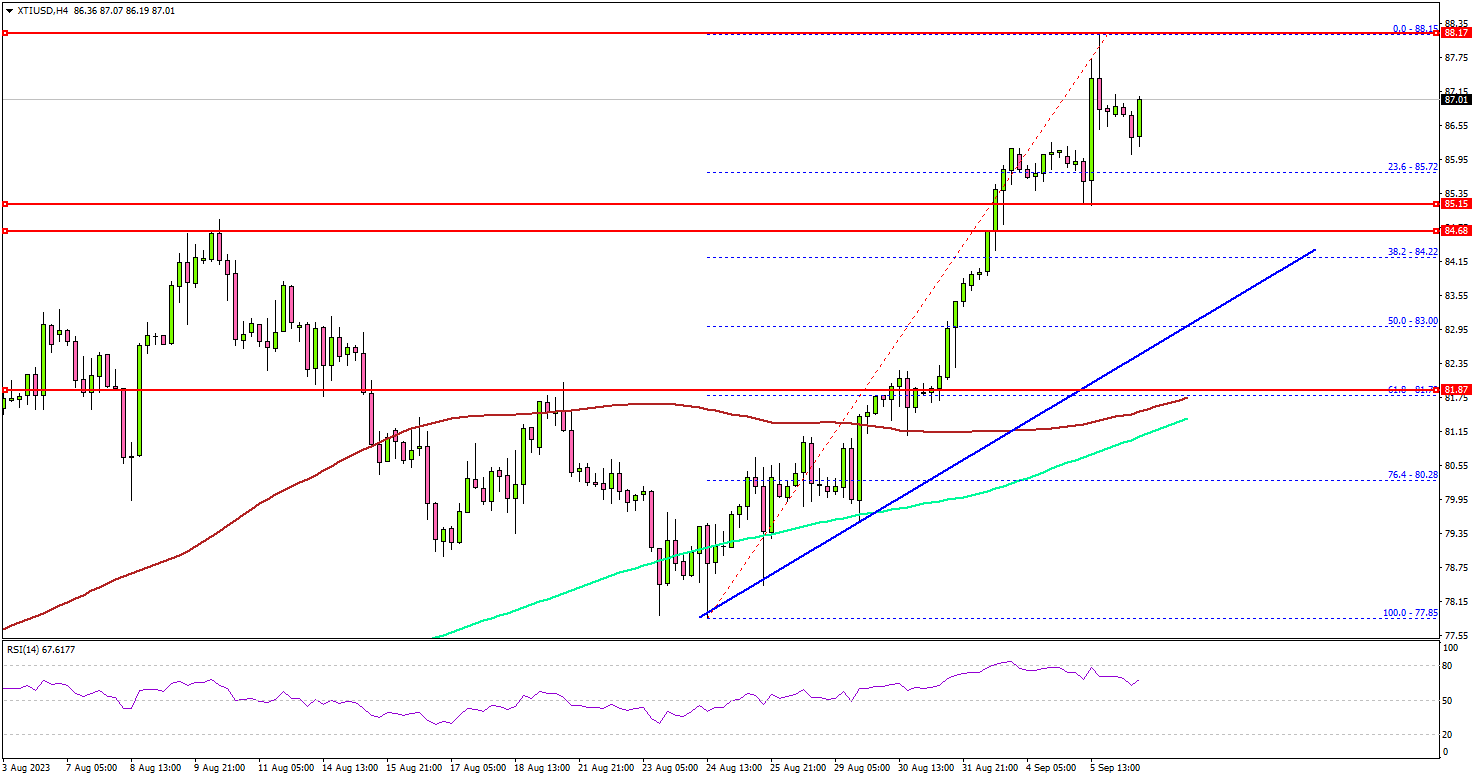
Looking at the 4-hour chart of XTI/USD, the price surpassed $85 and settled above the 100 simple moving average (red, 4-hour) and the 200 simple moving average (green, 4-hour).
Finally, it tested the $88.00 resistance zone. Recently, there was a minor downside correction below the $87 level. However, the bulls seem to be active above the $85.80 level. The 23.6% Fib retracement level of the upward move from the $77.85 swing low to the $88.15 high is also near $85.75.
The next major support sits near the $84.00 zone. There is also a key bullish trend line forming with support near $84.20 on the same chart.
Any more losses might call for a test of the $82 support zone in the coming days. On the upside, the price might face resistance near the $88 level. The next major resistance is near the $88.80 level, above which the price may perhaps accelerate higher. In the stated case, it could even visit the $90 resistance.
Looking at gold prices, there was a downside correction below the $1,930 level but the bulls might be active near $1,915.
Economic Releases to Watch Today
- Euro Zone Gross Domestic Product for Q2 2023 (QoQ) – Forecast 0.3%, versus 0.3% previous.
- Euro Zone Gross Domestic Product for Q2 2023 (YoY) – Forecast 0.6%, versus 0.6% previous.
- US Initial Jobless Claims – Forecast 234K, versus 228K previous.


