
Short term Elliott Wave view suggests the USDX is correcting cycle from 9.28.2022 high in an expanded flat structure. Down from 9.28.2022 high, wave (A) ended at 100.82 and wave (B) is still ending a flat correction higher. Up from 100.82 wave A ended at 105.88. Then we saw 3 swings lower to end wave B at 99.58 and after that, the index rallied in wave C of (B). The dollar should be near to end wave (B) where market will turn lower in wave (C).
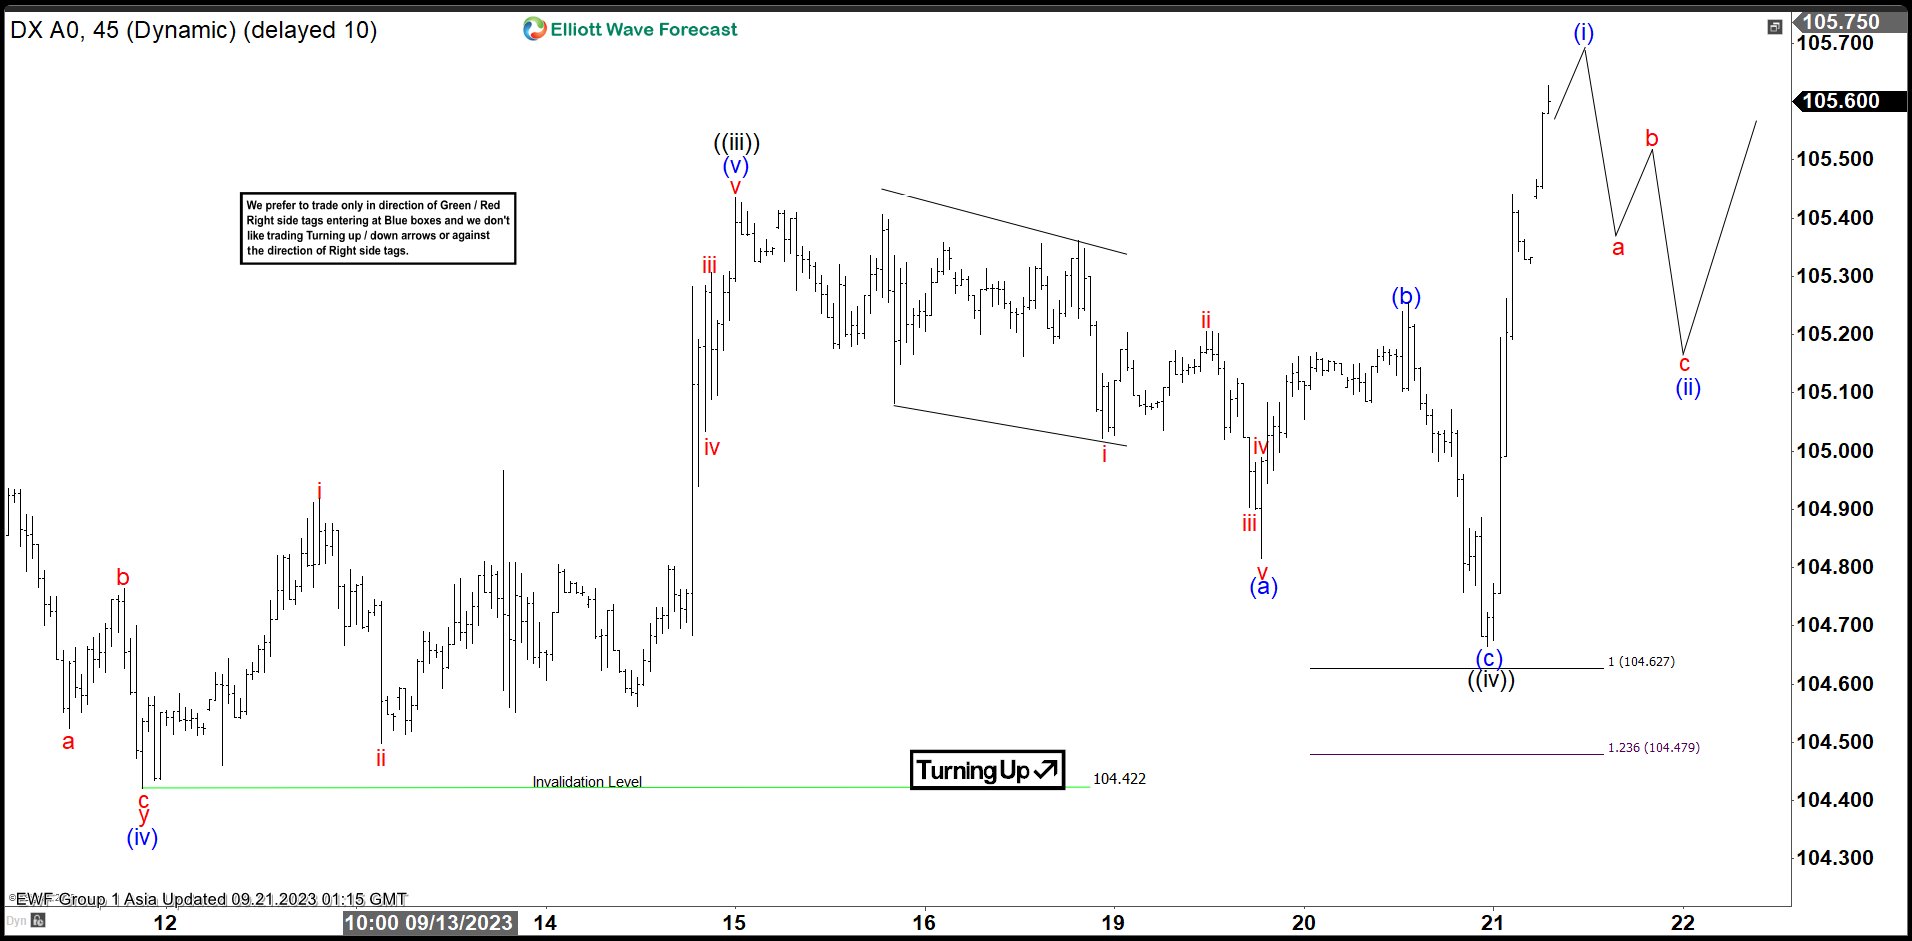
1 hour chart below shows wave ((iii)) of C ended at 105.43 high. Down from wave ((iii)), wave (a) ended at 104.82 and pullback in wave (b) ended at 105.25. Final leg higher wave (c) ended at 104.66 which completed wave ((iv)). Dollar index has resumed higher in wave ((v)). Currently, it is still developing wave (i) and once completed, the dollar should see 3, 7 or 11 swings lower to finish wave (ii) and rally again in wave (iii) of ((v)). The view is valid as stays above 104.66 low. A break below this level, open the possibility that wave ((v)) is ended and therefore wave C of (B).
USDX 60 Minutes Elliott Wave Chart
USDX Elliott Wave Video


By loading the video, you agree to YouTube’s privacy policy.
Learn more


%20ended%20at%20100.82%20and%20wave%20(B)%20is%20still%20ending%20a%20flat%20correction%20higher.%20Up%20from%20100.82%20wave%20A%20ended%20at%20105.88.%20Then%20we%20saw%203%20swings%20lower%20to%20end%20wave%20B%20at%2099.58%20and%20after%20that,%20the%20index%20rallied%20in%20wave%20C%20of%20(B).%20The%20dollar%20should%20be%20near%20to%20end%20wave%20(B)%20where%20market%20will%20turn%20lower%20in%20wave%20(C).)