
Short Term Elliott Wave in Silver (XAGUSD) suggests cycle from 5.5.2023 high ended with wave ((2)) at 20.65. Internal subdivision of wave ((2)) unfolded in a double three Elliott Wave structure. Down from 5.5.2023 high, wave (W) ended at 22.1 and wave (X) ended at 25.26. Wave (Y) ended at 20.65 which completed wave ((2)) as the 45 minutes chart below shows. The metal has turned higher in wave ((3)).
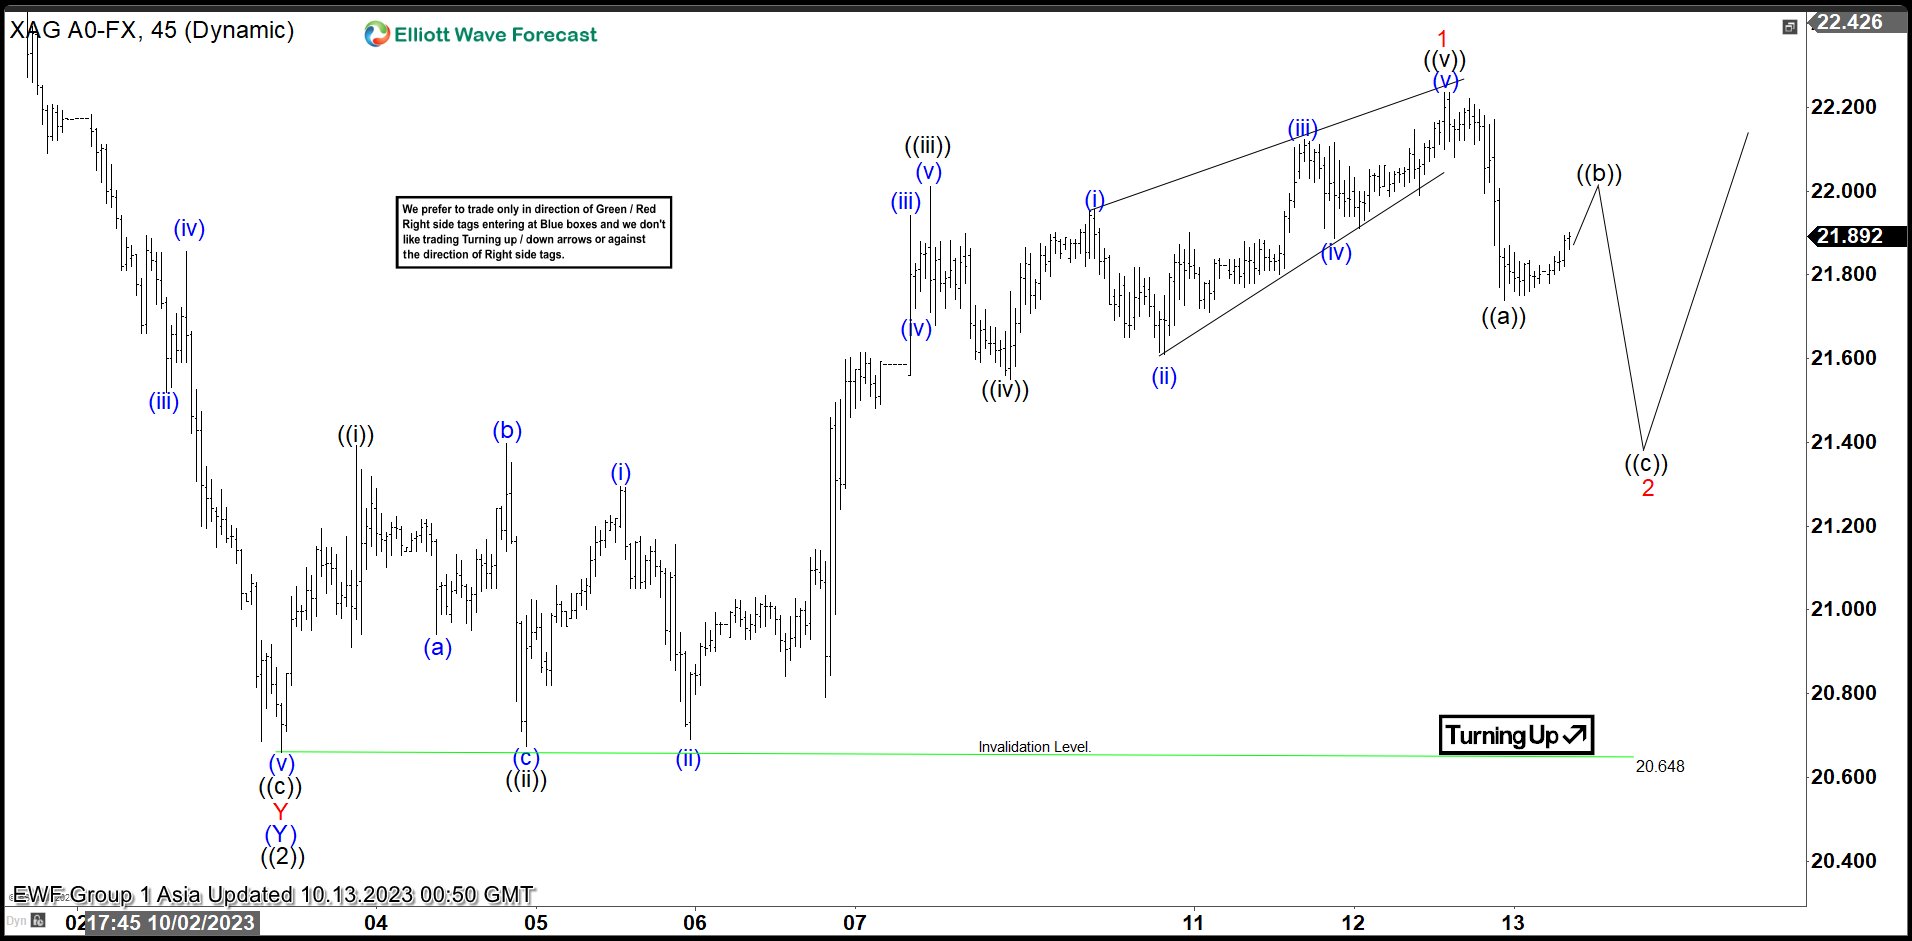
Up from wave ((2)), wave ((i)) ended at 21.39 and pullback in wave ((ii)) ended at 20.67. The metal resumes higher in wave ((iii)) towards 22 and dips in wave ((iv)) ended at 21.55. Final leg higher wave ((v)) ended as a diagonal at 22.23. This completed wave 1 in higher degree. Wave 2 pullback is now in progress to correct cycle from 10.3.2023 low before the metal resumes higher. Internal subdivision of wave 2 is unfolding as a zigzag structure. Down from wave 1, wave ((a)) ended at 21.74. Expect wave ((b)) to fail below 22.23 and the metal to turn lower in wave ((c)) before ending wave 2 correction. Near term, as far as pivot at 20.64 low stays intact, expect pullback to find support in 3, 7, or 11 swing for further upside.
Silver 45 Minutes Elliott Wave Chart
Silver (XAGUSD) Elliott Wave Video


By loading the video, you agree to YouTube’s privacy policy.
Learn more

 Pullback to Find Support")


 Looking to Extend Higher in a Nest")


%20suggests%20cycle%20from%205.5.2023%20high%20ended%20with%20wave%20((2))%20at%2020.65.%20Internal%20subdivision%20of%20wave%20((2))%20unfolded%20in%20a%20double%20three%20Elliott%20Wave%20structure.%20Down%20from%205.5.2023%20high,%20wave%20(W)%20ended%20at%2022.1%20and%20wave%20(X)%20ended%20at%2025.26.%20Wave%20(Y)%20ended%20at%2020.65%20which%20completed%20wave%20((2))%20as%20the%2045%20minutes%20chart%20below%20shows.%20The%20metal%20has%20turned%20higher%20in%20wave%20((3)).)