
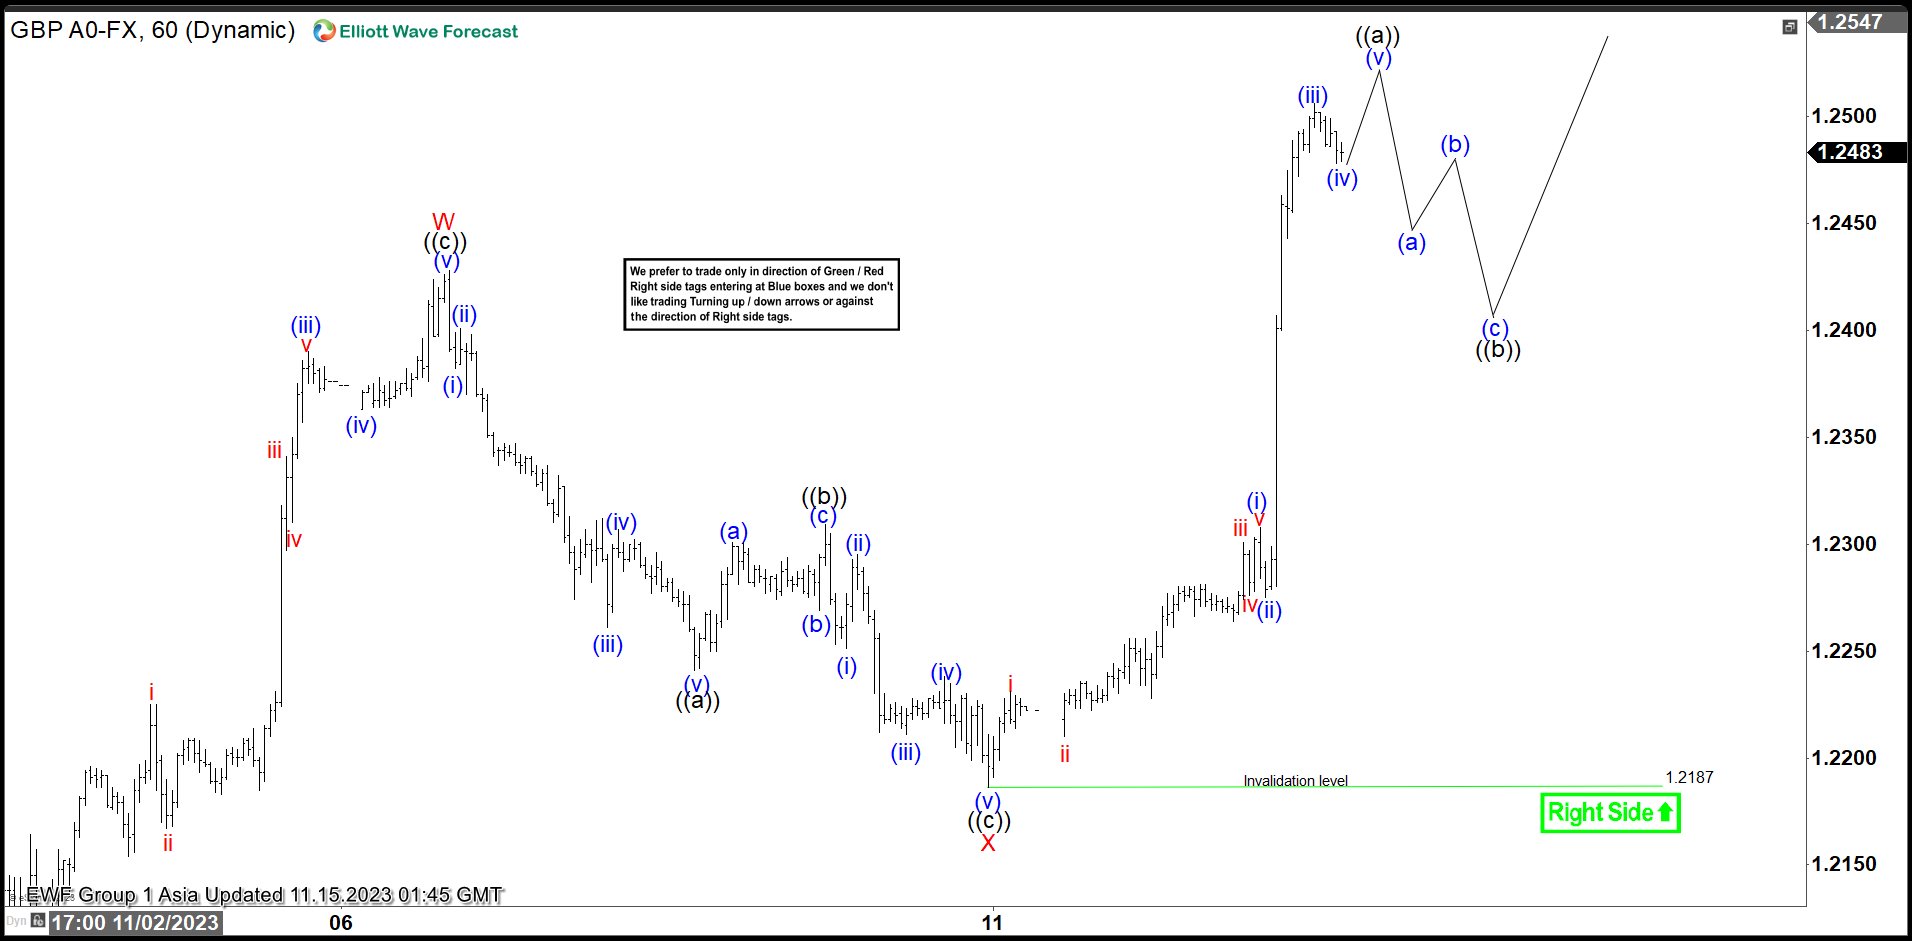
GBPUSD shows a 5 swing sequence from 10.4.2023 low favoring further upside. The rally from 10.4.2023 low takes the form of a double three Elliott Wave structure or a double zigzag. Up from 10.4.2023 low, wave W ended at 1.24.28 and dips in wave X ended at 1.2186. Internal subdivision of wave X unfolded as a zigzag Elliott Wave structure. Down from wave W, wave ((a)) ended at 1.224 and wave ((b)) ended at 1.2309. Wave ((c)) lower ended at 1.2187 which completed wave X.
Pair has since turned higher in wave Y. Internal subdivision of wave Y is unfolding as another zigzag structure. Up from wave X, wave (i) ended at 1.2308 and wave (ii) pullback ended at 1.2275. Wave (iii) higher ended at 1.2506, and wave (iv) ended at 1.2478. Expect pair to extend higher in wave (v) to end wave ((a)). Afterwards, it should pullback in wave ((b)) to correct cycle from 11.10.2023 low before the rally resumes. Near term, as far as pivot at 1.2187 low stays intact, expect dips to find support in 3, 7, 11 swing for further upside. Potential target higher is 100% – 161.8% Fibonacci extension of wave W. This area comes at 1.257 – 1.282.
GBPUSD 60 Minutes Elliott Wave Chart
GBPUSD Elliott Wave Video


By loading the video, you agree to YouTube’s privacy policy.
Learn more


)%20ended%20at%201.224%20and%20wave%20((b))%20ended%20at%201.2309.%20Wave%20((c))%20lower%20ended%20at%201.2187%20which%20completed%20wave%20X.)