
A rampant U.S. has gold longs watching long-term support nervously while silver, although still shakey, continues to outperform relatively.
Gold
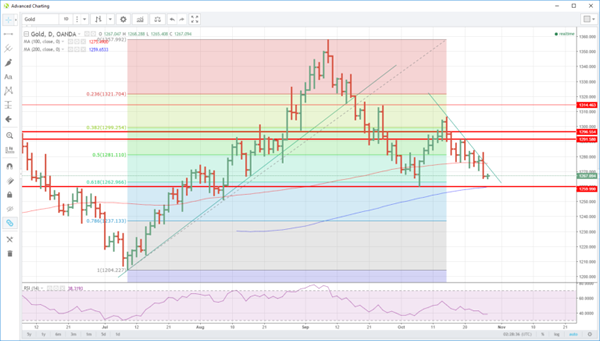
Gold’s incipient recovery came to an abrupt end overnight as the rally stopped dead at 1282.00 before gold plunged to close at 1267.00 in New York. It wilted in the face of a rampant U.S. dollar as the dollar index climbed by 1.20% overnight. In the process the 100-day moving average finally gave way on a closing basis, having held gold sell-offs for the week to leave gold poised dangerously near longer-term support.
How gold finishes the week will now be entirely at the whim of the U.S. dollar and U.S. yields with little to no geopolitical safe haven premium left in the price. The futures market is still constructively long the yellow metal, and this will continue to weigh on prices as fresh buyers appear to be few and far between.
Gold is unchanged at 1266.25 this morning with trendline resistance at 1272.50 followed by the 100-day moving average at 1275.50 and a triple daily top at 1284.00. The overnight low at 1265.80 is nearby support with a break opening up a possible test of 1260.00. This level is now crucial technical support being the October low and also the 200-day moving average. A daily close below this level may well see a lot of the long futures positioning deciding to hoist the white flag and head for the exit door.

Silver
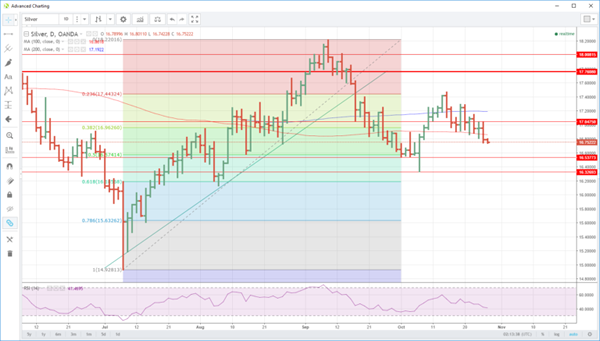
Silver tells much the same story as it to, fell through its 100-day moving average which had supported the price for the last seven days. Unlike gold though, silver has more technical support, and its selloff has been much less dramatic than golds. It may be because the level of speculative long positioning in the futures markets is substantially lower than golds.
Silver fell from 17.0475 to 16.7900 overnight and has continued to drift slightly lower in Asia to 16.7630. The 100-day moving average is now resistance at 16.8620, and it has formed a double top above at 17.04750 with the 200-day moving average behind this at 17.1925.
Support can be found initially at the overnight low of 16.7500. This is followed by a series of daily lows at 16.5375 as well as the 50% retracement at 16.5700. This should form substantial support, at least initially. Below this is the October low at 16.3270 and then the 61.80% retracement at 16.1900.


