
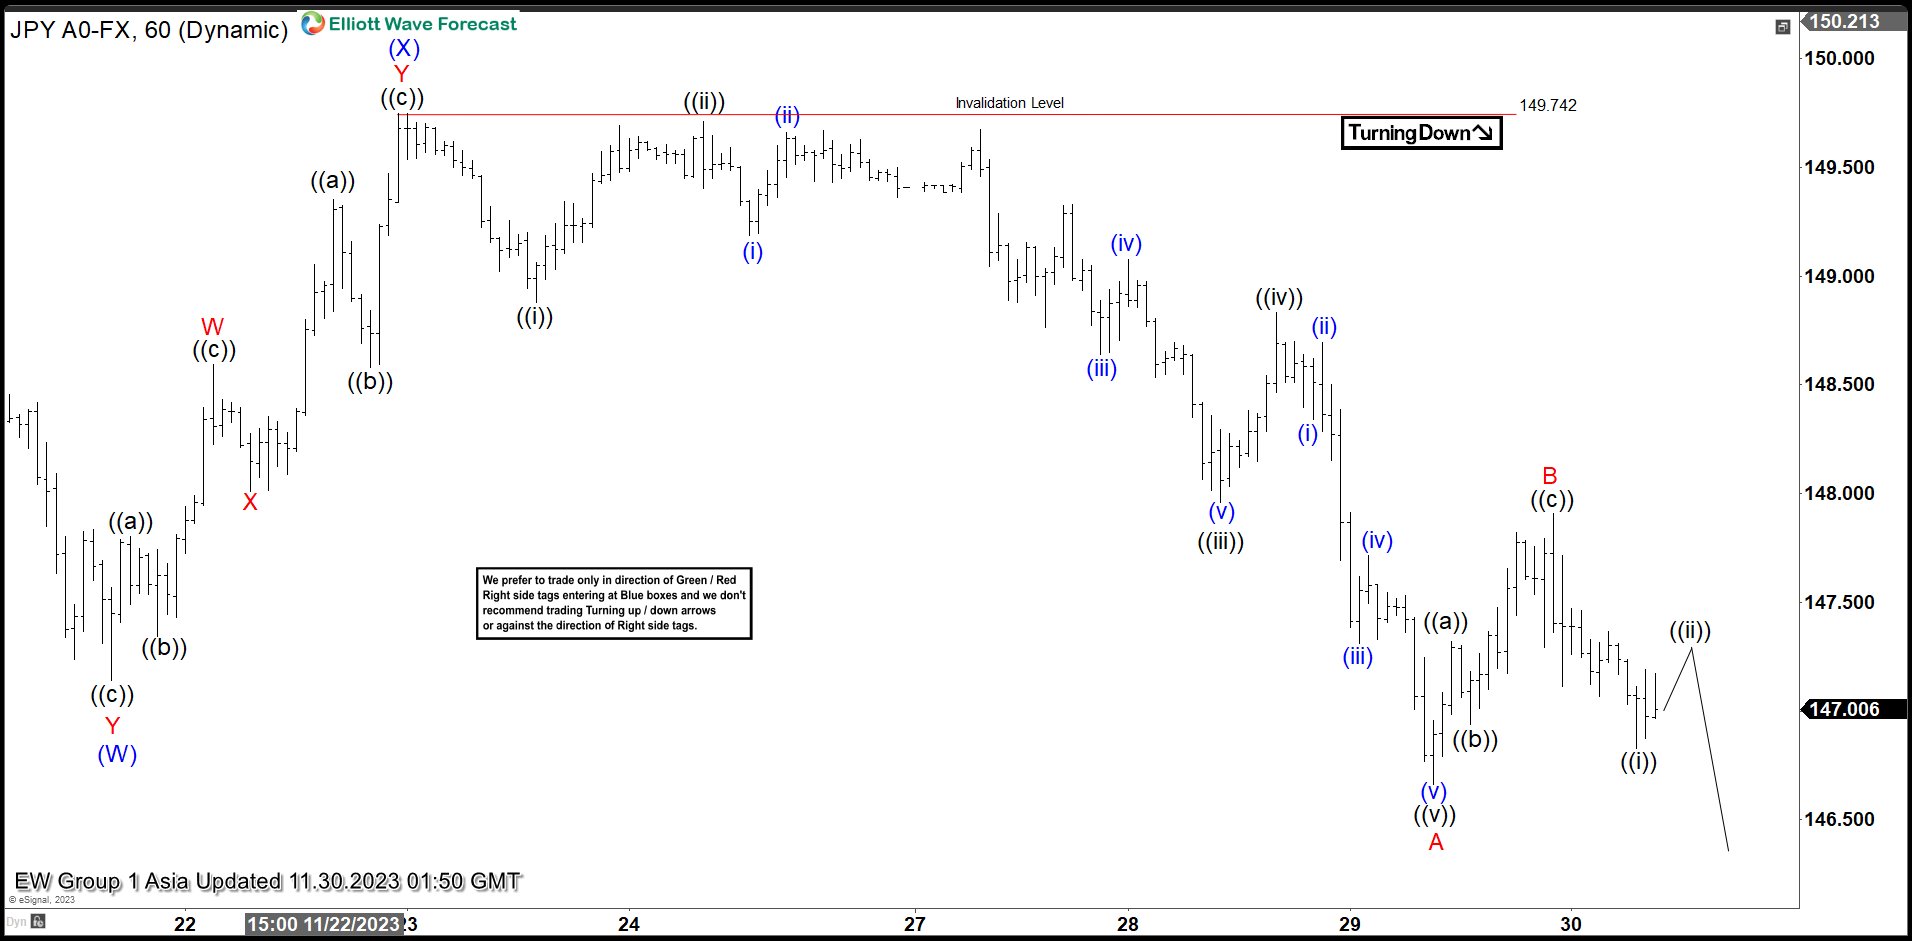
USDJPY shows incomplete bearish sequence from 11.13.2023 suggesting further downside. Down from 11.13.2023 high, decline is unfolding as a double three Elliott Wave structure. Down from 11.13.2023 high, wave (W) ended at 147.15. Wave (X) ended at 149.78 with internal subdivision as a double three in lesser degree. Up from wave (W), wave W ended at 148.59 and dips in wave X ended at 148. Wave Y higher ended at 149.78 which completed wave (X).
Wave (Y) lower is in progress with internal subdivision as a zigzag structure. Down from wave (X), wave ((i)) ended at 148.87 and wave ((ii)) rally ended at 149.71. Pair extended lower in wave ((iii)) towards 147.96 and rally in wave ((iv)) ended at 148.83. Final leg wave ((v)) ended at 146.66 which completed wave A. Rally in wave B ended at 147.9 with internal subdivision as a zigzag. Up from wave A, wave ((a)) ended at 147.32, and wave ((b)) pullback ended at 146.94. Wave ((c)) higher ended at 147.9 which completed wave B. Near term, as far as pivot at 149.78 high stays intact, expect rally to fail in 3, 7, or 11 swing for further downside in wave C.
USDJPY 60 Minutes Elliott Wave Chart
USDJPY Elliott Wave Video


By loading the video, you agree to YouTube’s privacy policy.
Learn more


%20ended%20at%20147.15.%20Wave%20(X)%20ended%20at%20149.78%20with%20internal%20subdivision%20as%20a%20double%20three%20in%20lesser%20degree.%20Up%20from%20wave%20(W),%20wave%20W%20ended%20at%20148.59%20and%20dips%20in%20wave%20X%20ended%20at%20148.%20Wave%20Y%20higher%20ended%20at%20149.78%20which%20completed%20wave%20(X).)