
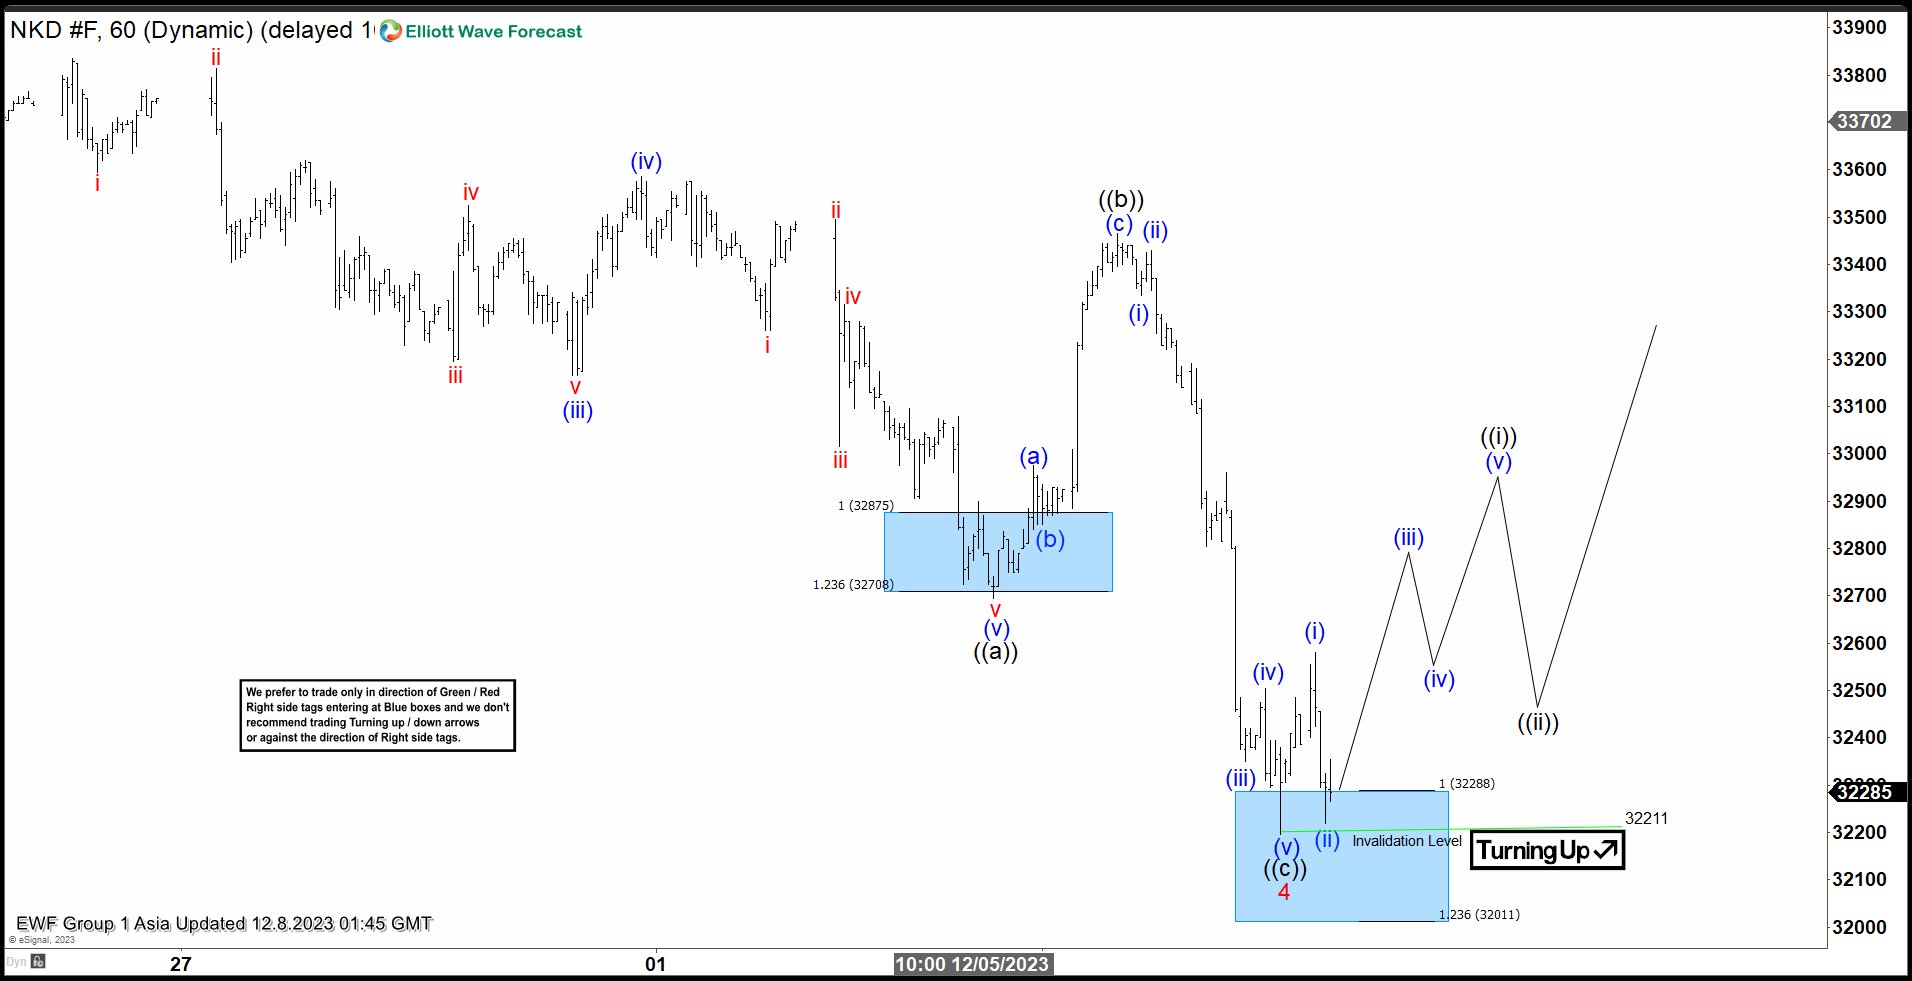
Cycle from 10.4.2023 low in Nikkei Futures (NKD) is in progress as a 5 waves Elliott Wave diagonal. Up from 10.4.2023 low, wave 1 ended at 32690 and pullback in wave 2 ended at 30405. The Index extended higher in wave 3 towards 33870. Wave 4 ended as a zigzag structure. Down from wave 3, wave (i) ended at 33200 and rally in wave (ii) ended at 33835. Index extended lower again in wave (iii) towards 33195 and wave (iv) ended at 33585. Wave (v) lower ended at 32695 which completed wave ((a)).
Corrective rally in wave ((b)) unfolded as a zigzag structure. Up from wave ((a)), wave (a) ended at 32975 and pullback in wave (b) ended at 32850. Final leg wave (c) ended at 33465 which completed wave ((b)). The Index then extended lower in wave ((c)) as a 5 waves impulse. Down from wave ((b)), wave (i) ended at 33335 and wave (ii) ended at 33430. Wave (iii) lower ended at 32350 and wave (iv) ended at 32505. Final leg wave (v) ended at 32211 which completed wave ((c)) of 4. Wave 5 higher is currently in progress. As far as pivot at 32211 low stays intact, expect the Index to extend higher. Break below 32211 from here suggests the Index is still in the process of ending wave 4.
Nikkei Futures (NKD) 60 Minutes Elliott Wave Chart
NKD_F Elliott Wave Video


By loading the video, you agree to YouTube’s privacy policy.
Learn more


%20is%20in%20progress%20as%20a%205%20waves%20Elliott%20Wave%20diagonal.%20Up%20from%2010.4.2023%20low,%20wave%201%20ended%20at%2032690%20and%20pullback%20in%20wave%202%20ended%20at%2030405.%20The%20Index%20extended%20higher%20in%20wave%203%20towards%2033870.%20Wave%204%20ended%20as%20a%20zigzag%20structure.%20Down%20from%20wave%203,%20wave%20(i)%20ended%20at%2033200%20and%20rally%20in%20wave%20(ii)%20ended%20at%2033835.%20Index%20extended%20lower%20again%20in%20wave%20(iii)%20towards%2033195%20and%20wave%20(iv)%20ended%20at%2033585.%20Wave%20(v)%20lower%20ended%20at%2032695%20which%20completed%20wave%20((a)).)