
- UK 100 meets upper Bollinger band
- Price encounters upside pressure above triangle formation
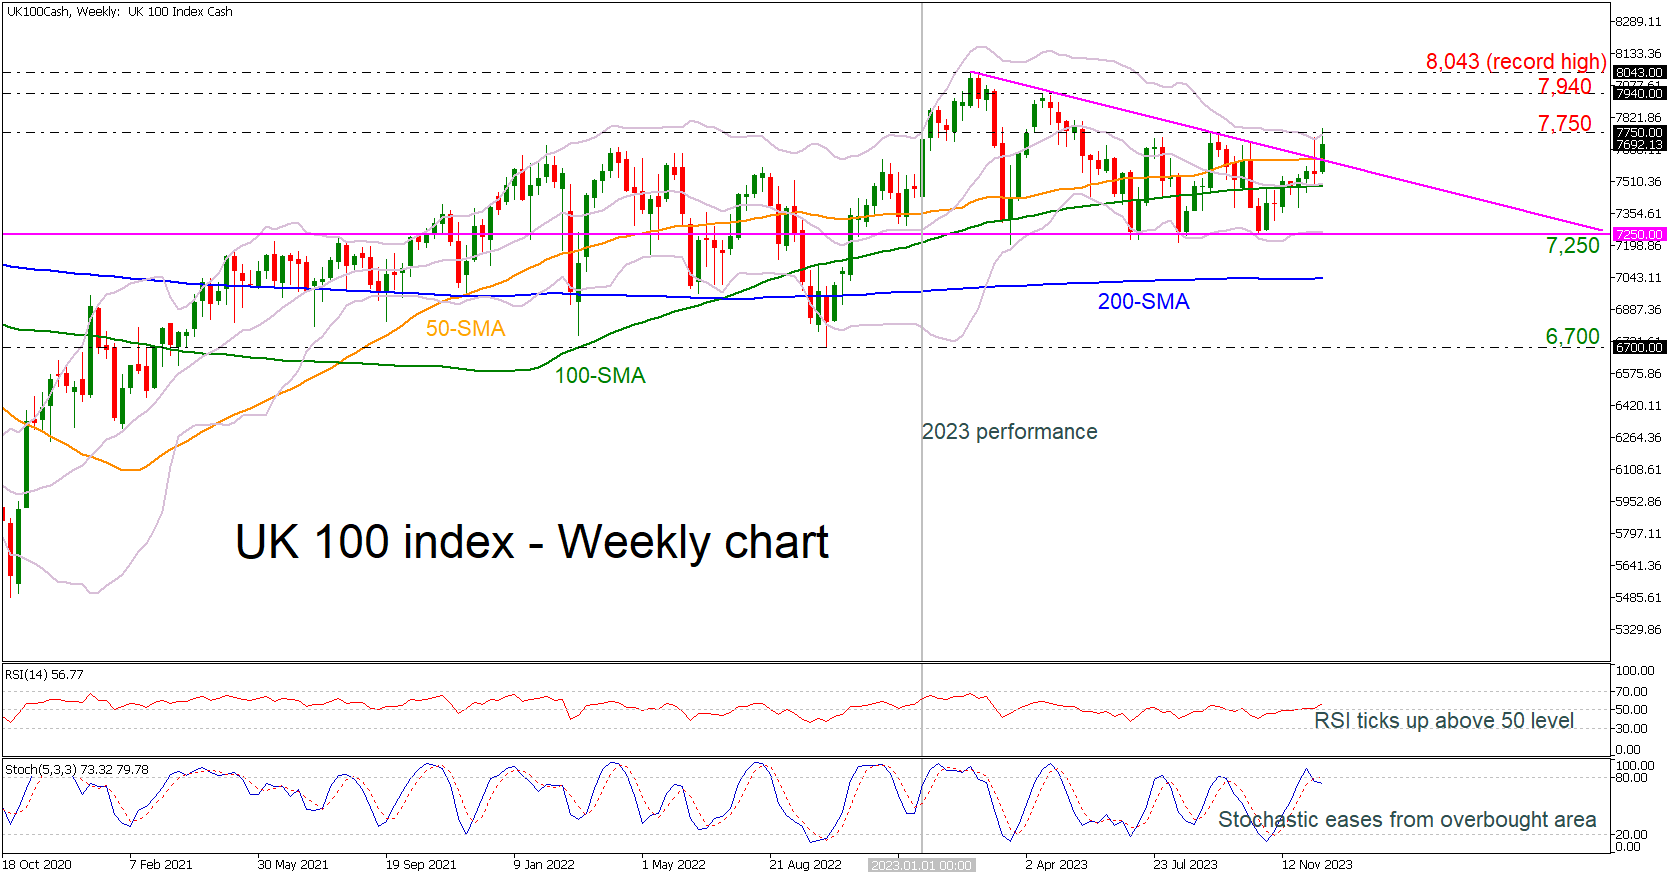
The UK 100 index a few weeks after the beginning of 2023 started a descending triangle formation with the top at 8,043 and a strong support level of 7,250. Currently, the price is standing above the falling trend line, after testing the upper Bollinger band and the 7,750 resistance.
According to the technical oscillators, the RSI is pointing slightly upwards in the positive territory; however, the stochastic posted a bearish crossover within its %K and %D lines in the overbought area, suggesting an overstretched market and a potential negative movement may be on cards during the start of 2024.
If the bullish pressures persist, the price could revisit its recent resistance of 7,750. Breaking above the tight range, the index might face the April peak of 7,940. A jump above that region could pave the way for the all-time high of 8,043.
Alternatively, should the bears attempt to push the price lower, initial declines could cease at the recent support of the mid-level of the Bollinger band and the 100-week simple moving average (SMA) at 7,490. Diving below that floor, the price may descend towards the significant 7,250 barricade, which coincides with the lower boundary of the triangle. Even lower, the 200-week SMA at 7,043 could provide downside protection.
In brief, the UK 100 index has been stuck within a range during 2023 but an upside movement soon could open the way for a bullish tendency in 2024.


