
Nasdaq 100 (NQ_F )shows a bullish sequence from October 2022 low favoring further upside. The rally higher from 10.13.2022 is unfolding as Elliott Wave leading diagonal. Up from 10.13.2022 low, wave ((1)) ended at 16062.75 and pullback in wave ((2)) ended at 14140.25 low. Wave ((3)) finished at 17165.94 high as the 1 hour chart below shows. Pullback as wave ((4)) is currently in progress with internal subdivision of a zigzag (A), (B) and (C).
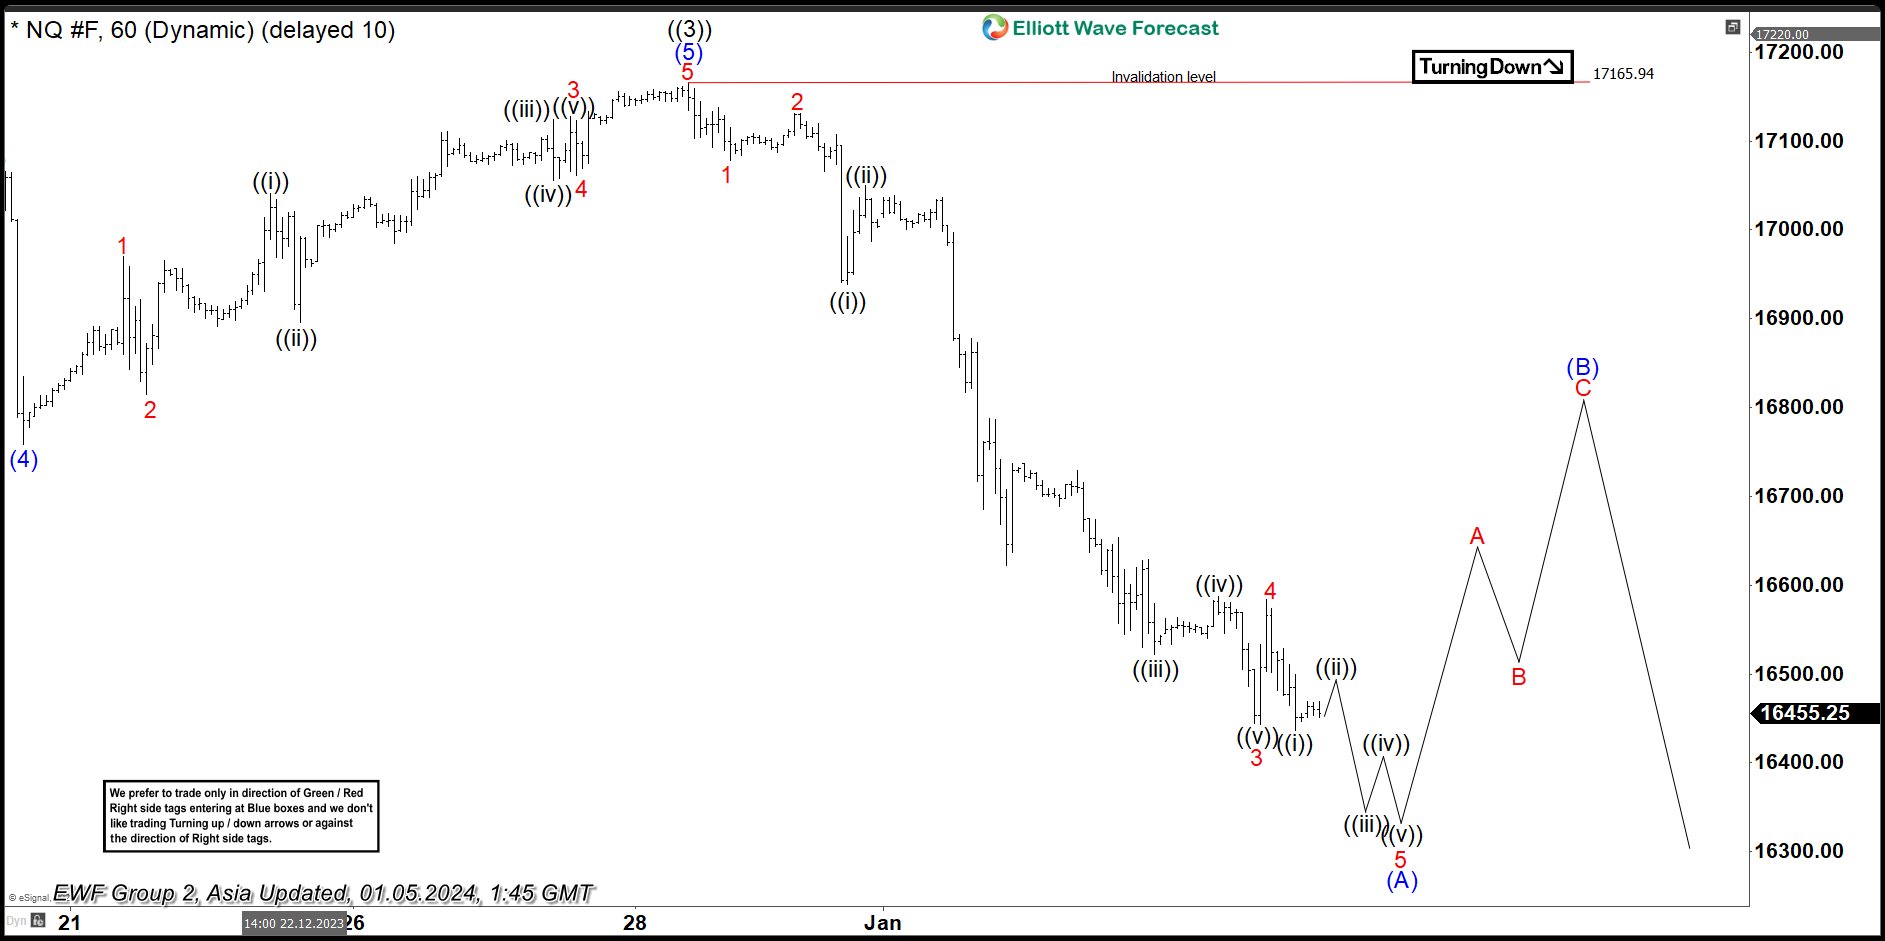
Down from ((3)), wave (A) is developing an impulse structure. Wave 1 ended 17077.75 low and bounced slightly completing wave 2 at 17131.00. Wave ((i)) of 3 in lesser degree ended at 16938.25 low and pullback as wave ((ii)) ended at 17049.75 high. Then, the Index dropped strongly to 16522.00 to complete wave ((iii)). Wave ((iv)) bounce ended 16587.25 and last leg lower ended at 16443.25 as wave ((v)). This completed wave 3 in higher degree.
Wave 4 correction finished at 16583.75 and the Index resumed to the downside. Expect NQ_F to continue to the downside in wave 5 to end complete wave (A) in higher degree. Wave 5 of (A) could drop to 16410 – 16357 area (1.236 – 1.618 inverse Fib retracement). After which, we should see a reaction higher in wave (B) before it resumes lower again. Near term, as far as pivot at 17165.94 high stays intact, the Index has scope to extend correction lower.
NQ_F 60 Minutes Elliott Wave Chart
NQ_F Elliott Wave Video


By loading the video, you agree to YouTube’s privacy policy.
Learn more


shows%20a%20bullish%20sequence%20from%20October%202022%20low%20favoring%20further%20upside.%20The%20rally%20higher%20from%2010.13.2022%20is%20unfolding%20as%20Elliott%20Wave%20leading%20diagonal.%20Up%20from%2010.13.2022%20low,%20wave%20((1))%20ended%20at%2016062.75%20and%20pullback%20in%20wave%20((2))%20ended%20at%2014140.25%20low.%20Wave%20((3))%20finished%20at%2017165.94%20high%20as%20the%201%20hour%20chart%20below%20shows.%20Pullback%20as%20wave%20((4))%20is%20currently%20in%20progress%20with%20internal%20subdivision%20of%20a%20zigzag%20(A),%20(B)%20and%20(C).)